
Page 693 - Provincial Treasury Estimates.pdf
P. 693
Estimates of the Provincial Revenue and Expenditure (EPRE) – 2023/24 Financial Year
The department had 135 beneficiaries in the EPWP Programme in 2023/24 financial year and this number
is expected to increase in 2023/24 due to addition of the Social Sector Grant of the EPWP.
7.6 Departmental Public-Private Partnership (PPP) projects
None.
7.7 Conditional grant payments
7.7.1 Conditional grant payments by grant
Table 8: Summary of departmental conditional grants by grant
Main Adjusted Revised
Outcome Medium-term estimates % change
appropriation appropriation estimate
from 2022/23
R thousand 2019/20 2020/21 2021/22 2022/23 2023/24 2024/25 2025/26
Community Library Services Grant 157 932 126 261 161 809 181 169 192 514 192 514 178 089 185 927 194 257 (7.5)
Mass Participation and Sport Development Grant 69 105 27 721 67 258 70 879 74 448 74 448 72 267 75 739 79 358 (2.9)
Expanded Public Works Programme Integrated Grant to Provinces 1 977 1 451 2 056 2 155 2 155 2 155 2 177 - - 1.0
Expanded Public Works Programme Social Sector Incentive Grant for Provinces - - - - - - 1 753 - -
Total 229 014 155 433 231 123 254 203 269 117 269 117 254 286 261 666 273 615 (5.5)
7.7.2 Conditional grant payments by economic classification
Table 9: Summary of departmental conditional grants by economic classification
Main Adjusted Revised
Outcome Medium-term estimates % change
appropriation appropriation estimate
from 2022/23
R thousand 2019/20 2020/21 2021/22 2022/23 2023/24 2024/25 2025/26
Current payments 153 381 98 174 138 522 160 281 163 337 162 737 170 824 172 190 180 131 5.0
Compensation of employees 72 260 71 973 63 573 82 425 81 382 76 390 90 960 97 496 100 827 19.1
Goods and services 81 121 26 201 74 949 77 856 81 955 86 347 79 864 74 694 79 304 (7.5)
Interest and rent on land - - - - - - - -
Transfers and subsidies 53 988 48 593 56 286 51 594 52 107 52 707 52 749 52 749 55 112 0.1
Provinces and municipalities 42 168 42 168 42 168 42 168 42 168 42 168 42 168 42 168 44 057
Departmental agencies and accounts - - - - - - - -
Universities and technikons - - - - - - - - -
Public corporations and private enterprises - - - - - - - - -
Public corporations and private enterprises - - - - - - - - -
Non-profit institutions 11 805 6 371 9 677 9 426 9 926 10 297 10 581 10 581 11 055 2.8
Households 15 54 4 441 - 13 242 - - - (100.0)
Payments for capital assets 21 645 8 666 36 315 42 328 53 673 53 673 30 713 36 727 38 373 (42.8)
Buildings and other fixed structures 18 978 7 474 30 642 39 221 50 566 50 566 28 692 33 925 35 445 (43.3)
Machinery and equipment 2 667 1 192 5 673 3 107 3 107 3 107 2 021 2 802 2 928 (35.0)
Heritage assets - - - - - - - - -
Specialised military assets - - - - - - - - -
Biological assets - - - - - - - - -
Land and sub-soil assets - - - - - - - - -
Software and other intangible assets - - - - - - - - -
Payments for financial assets - - - - - - - - -
Total 229 014 155 433 231 123 254 203 269 117 269 117 254 286 261 666 273 615 (5.5)
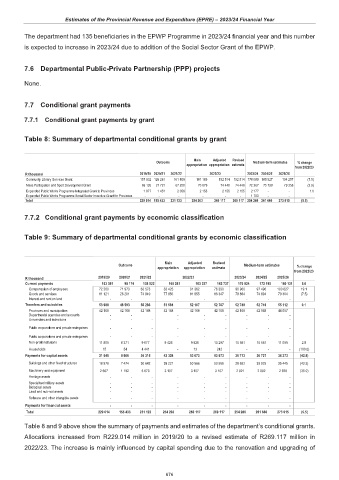
Table 8 and 9 above show the summary of payments and estimates of the department’s conditional grants.
Allocations increased from R229.014 million in 2019/20 to a revised estimate of R269.117 million in
2022/23. The increase is mainly influenced by capital spending due to the renovation and upgrading of
676