
Page 104 - Demo
P. 104
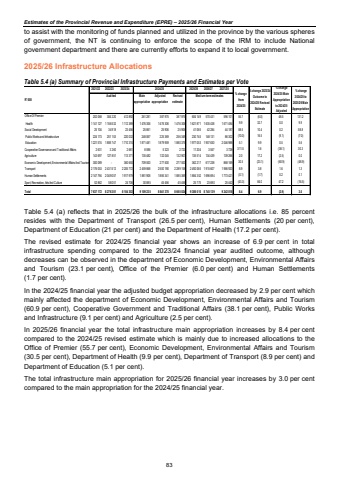
Estimates of the Provincial Revenue and Expenditure (EPRE) %u2013 2025/26 Financial Yearto assist with the monitoring of funds planned and utilized in the province by the various spheres of government, the NT is continuing to enforce the scope of the IRM to include National government department and there are currently efforts to expand it to local government. 2025/26 Infrastructure Allocations Table 5.4 (a) Summary of Provincial Infrastructure Payments and Estimates per Vote Table 5.4 (a) reflects that in 2025/26 the bulk of the infrastructure allocations i.e. 85 percentresides with the Department of Transport (26.5 per cent), Human Settlements (20 per cent), Department of Education (21 per cent) and the Department of Health (17.2 per cent). The revised estimate for 2024/25 financial year shows an increase of 6.9 per cent in total infrastructure spending compared to the 2023/24 financial year audited outcome, although decreases can be observed in the department of Economic Development, Environmental Affairs and Tourism (23.1 per cent), Office of the Premier (6.0 per cent) and Human Settlements (1.7 per cent). In the 2024/25 financial year the adjusted budget appropriation decreased by 2.9 per cent which mainly affected the department of Economic Development, Environmental Affairs and Tourism (60.9 per cent), Cooperative Government and Traditional Affairs (38.1 per cent), Public Works and Infrastructure (9.1 per cent) and Agriculture (2.5 per cent). In 2025/26 financial year the total infrastructure main appropriation increases by 8.4 per cent compared to the 2024/25 revised estimate which is mainly due to increased allocations to the Office of Premier (55.7 per cent), Economic Development, Environmental Affairs and Tourism (30.5 per cent), Department of Health (9.9 per cent), Department of Transport (8.9 per cent) and Department of Education (5.1 per cent). The total infrastructure main appropriation for 2025/26 financial year increases by 3.0 per cent compared to the main appropriation for the 2024/25 financial year. 2021/22 2022/23 2023/24 2025/26 2026/27 2027/28Audited MainappropriationAdjusted appropriation Revised estimate Medium-term estimates 202 068 304 220 412 892 261 281 387 975 387 975 604 149 570 431 596 101 55.7 (6.0) 48.5 131.21 141 127 1 156 532 1 112 389 1 476 306 1 476 306 1 476 306 1 621 871 1 635 438 1 671 494 9.9 32.7 0.0 9.9 25 104 34 918 23 456 25 861 25 906 25 906 41 065 42 284 44 187 58.5 10.4 0.2 58.8 224 173 251 153 220 032 248 067 225 369 256 349 230 745 148 131 86 302 (10.0) 16.5 (9.1) (7.0)1 221 574 1 859 747 1 710 374 1 871 481 1 879 959 1 880 375 1 977 053 1 957 630 2 046 988 5.1 9.9 0.5 5.6 2 631 3 260 2 681 8 596 5 323 2 723 11 204 3 557 3 728 311.5 1.6 (38.1) 30.3 143 697 127 851 113 371 135 482 132 045 132 907 135 514 134 439 139 266 2.0 17.2 (2.5) 0.0 300 089 - 360 650 709 500 277 500 277 500 362 217 617 238 868 169 30.5 (23.1) (60.9) (48.9)2 176 053 2 431 512 2 205 772 2 459 868 2 500 190 2 289 158 2 492 065 1 915 607 1 986 920 8.9 3.8 1.6 1.32 147 794 2 049 057 1 917 979 1 881 908 1 885 341 1 885 369 1 884 352 1 696 694 1 773 421 (0.1) (1.7) 0.2 0.1 52 862 58 051 24 706 30 885 45 456 45 456 25 775 23 690 25 442 (43.3) 84.0 47.2 (16.5)Total 7 637 172 8 276 301 8 104 302 9 109 235 8 841 370 8 660 024 9 386 010 8 745 139 9 242 018 8.4 6.9 (2.9) 3.02024/25Office Of PremierHealthSocial Development Public Works and Infrastructure EducationCooperative Governance and Traditional AffairsR' 000AgricultureEconomic Development, Environmental Affairs And TourismTransportHuman SettlementsSport, Recreation, Arts And Culture % change 2024/25 to 2025/26 Main Appropriation% change 2023/24 Outcome to 2024/25 Revised Estimate% change from 2024/25% change 2024/25 Main Appropriation to 2024/25 Adjusted 83
