
Page 98 - Demo
P. 98
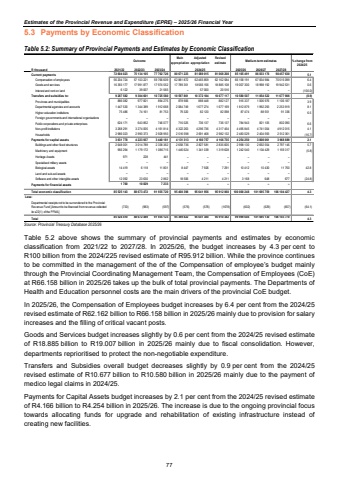
Estimates of the Provincial Revenue and Expenditure (EPRE) %u2013 2025/26 Financial Year5.3 Payments by Economic Classification Table 5.2: Summary of Provincial Payments and Estimates by Economic Classification Source: Provincial Treasury Database 2025/26 Table 5.2 above shows the summary of provincial payments and estimates by economic classification from 2021/22 to 2027/28. In 2025/26, the budget increases by 4.3 per cent to R100 billion from the 2024/225 revised estimate of R95.912 billion. While the province continues to be committed in the management of the of the Compensation of employee%u2019s budget mainly through the Provincial Coordinating Management Team, the Compensation of Employees (CoE) at R66.158 billion in 2025/26 takes up the bulk of total provincial payments. The Departments of Health and Education personnel costs are the main drivers of the provincial CoE budget. In 2025/26, the Compensation of Employees budget increases by 6.4 per cent from the 2024/25 revised estimate of R62.162 billion to R66.158 billion in 2025/26 mainly due to provision for salary increases and the filling of critical vacant posts. Goods and Services budget increases slightly by 0.6 per cent from the 2024/25 revised estimate of R18.885 billion to R19.007 billion in 2025/26 mainly due to fiscal consolidation. However, departments reprioritised to protect the non-negotiable expenditure. Transfers and Subsidies overall budget decreases slightly by 0.9 per cent from the 2024/25 revised estimate of R10.677 billion to R10.580 billion in 2025/26 mainly due to the payment of medico legal claims in 2024/25. Payments for Capital Assets budget increases by 2.1 per cent from the 2024/25 revised estimate of R4.166 billion to R4.254 billion in 2025/26. The increase is due to the ongoing provincial focus towards allocating funds for upgrade and rehabilitation of existing infrastructure instead of creating new facilities. Outcome Main appropriationAdjusted appropriationRevised estimate Medium-term estimatesR thousand 2021/22 2022/23 2023/24 2025/26 2026/27 2027/28Current payments 75 134 105 72 604 023 77 762 726 80 671 223 81 089 015 81 068 208 85 165 491 86 833 176 90 457 630 5.1Compensation of employees 56 204 724 57 103 221 59 766 609 62 881 872 62 465 859 62 162 584 66 158 191 67 834 984 70 515 099 6.4Goods and services 16 393 177 17 991 877 17 974 552 17 789 351 18 566 156 18 885 108 19 007 300 18 998 192 19 942 531 0.6Interest and rent on land 6 122 39 007 21 565 %u2013 57 000 20 516 %u2013 %u2013 %u2013 (100.0)Transfers and subsidies to: 9 287 582 9 304 601 10 725 580 10 597 861 10 372 184 10 677 117 10 580 507 11 054 522 11 677 908 (0.9)Provinces and municipalities 886 082 977 821 894 275 878 906 888 448 882 127 916 337 1 006 976 1 106 187 3.9Departmental agencies and accounts 1 447 530 1 344 389 1 912 668 2 084 749 1 677 274 1 677 169 1 812 879 1 992 293 2 253 919 8.1Higher education institutions 75 486 74 161 81 753 79 320 82 120 82 098 87 474 88 551 91 336 6.5Foreign governments and international organisations %u2013 %u2013 %u2013 %u2013 %u2013 %u2013 %u2013 %u2013 %u2013 Public corporations and private enterprises 624 171 643 852 746 077 716 025 736 137 736 137 784 943 821 105 802 090 6.6Non-profit institutions 3 268 291 3 274 005 4 161 814 4 322 263 4 296 736 4 317 454 4 495 845 4 741 004 4 912 015 4.1Households 2 986 023 2 990 373 2 928 993 2 516 598 2 691 468 2 982 132 2 483 029 2 404 593 2 512 361 (16.7)Payments for capital assets 3 631 778 4 223 937 3 440 181 4 131 313 4 180 757 4 166 735 4 254 250 3 808 061 3 968 889 2.1Buildings and other fixed structures 2 648 001 3 014 789 2 338 362 2 658 736 2 827 581 2 835 605 2 998 130 2 692 554 2 797 145 5.7Machinery and equipment 956 294 1 179 172 1 086 715 1 445 624 1 341 039 1 319 628 1 242 540 1 104 429 1 159 317 (5.8)Heritage Assets 971 228 441 %u2013 %u2013 %u2013 %u2013 %u2013 %u2013 Specialised military assets %u2013 %u2013 %u2013 %u2013 %u2013 %u2013 %u2013 %u2013 %u2013 Biological assets 14 419 6 118 11 801 8 447 7 926 7 291 10 412 10 430 11 750 42.8Land and sub-soil assets %u2013 %u2013 %u2013 %u2013 %u2013 %u2013 %u2013 %u2013 %u2013 Software and other intangible assets 12 092 23 630 2 862 18 506 4 211 4 211 3 168 648 677 (24.8)Payments for financial assets 1 760 10 829 7 233 %u2013 %u2013 %u2013 %u2013 %u2013 %u2013 Total economic classification 85 525 143 88 673 472 91 935 720 95 400 398 95 641 956 95 912 060 100 000 248 101 695 759 106 104 427 4.3Less: Departmental receipts not to be surrendered to the Provincial Revenue Fund [Amount to be financed from revenue collected ito s22(1) of the PFMA](733) (983) (597) (576) (576) (1678) (602) (629) (657) (64.1)Total 85 524 410 88 672 489 91 935 123 95 399 822 95 641 380 95 910 382 99 999 646 101 695 130 106 103 770 4.32024/25% change from 2024/2577
