
Page 145 - Demo
P. 145
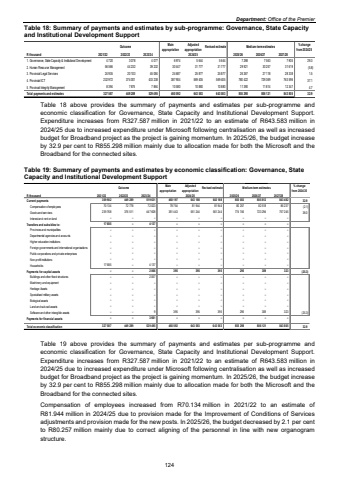
Department: Office of the Premier Table 18: Summary of payments and estimates by sub-programme: Governance, State Capacity and Institutional Development Support Outcome Main appropriationAdjusted appropriation Revised estimate Medium-term estimates % change from 2024/25R thousand 2021/22 2022/23 2023/24 2025/26 2026/27 2027/281. Governance, State Capacity & Institutional Development 3 078 4 720 4 077 6 974 5 644 5 644 7 298 7 563 7 905 29.32. Human Resource Management 56 566 44 232 39 232 30 447 31 777 31 777 29 921 30 257 31 619 (5.8)3. Provincial Legal Services 24 935 20 103 45 084 24 687 25 877 25 877 26 267 27 118 28 338 1.54. Provincial ICT 232 972 374 001 433 238 387 904 569 405 569 405 780 422 729 369 763 596 37.15. Provincal Integrity Management 8 394 7 875 7 864 10 580 10 880 10 880 11 390 11 814 12 347 4.7Total payments and estimates 327 587 449 289 529 495 460 592 643 583 643 583 855 298 806 121 843 805 32.92024/25Table 18 above provides the summary of payments and estimates per sub-programme and economic classification for Governance, State Capacity and Institutional Development Support. Expenditure increases from R327.587 million in 2021/22 to an estimate of R643.583 million in 2024/25 due to increased expenditure under Microsoft following centralisation as well as increased budget for Broadband project as the project is gaining momentum. In 2025/26, the budget increase by 32.9 per cent to R855.298 million mainly due to allocation made for both the Microsoft and the Broadband for the connected sites. Table 19: Summary of payments and estimates by economic classification: Governance, State Capacity and Institutional Development Support Outcome Main appropriationAdjusted appropriation Revised estimate Medium-term estimates % change from 2024/25R thousand 2021/22 2022/23 2023/24 2025/26 2026/27 2027/28Current payments 449 289 309 902 519 631 460 197 643 188 643 188 855 003 805 812 843 482 32.9Compensation of employees 70 134 72 778 72 023 78 754 81 944 81 944 80 257 82 518 86 237 (2.1)Goods and services 239 768 376 511 447 608 381 443 561 244 561 244 774 746 723 294 757 245 38.0Interest and rent on land %u2013 %u2013 %u2013 %u2013 %u2013 %u2013 %u2013 %u2013 %u2013Transfers and subsidies to: 17 685 %u2013 4 137 %u2013 %u2013 %u2013 %u2013 %u2013 %u2013Provinces and municipalities %u2013 %u2013 %u2013 %u2013 %u2013 %u2013 %u2013 %u2013 %u2013Departmental agencies and accounts %u2013 %u2013 %u2013 %u2013 %u2013 %u2013 %u2013 %u2013 %u2013Higher education institutions %u2013 %u2013 %u2013 %u2013 %u2013 %u2013 %u2013 %u2013 %u2013Foreign governments and international organisations %u2013 %u2013 %u2013 %u2013 %u2013 %u2013 %u2013 %u2013 %u2013Public corporations and private enterprises %u2013 %u2013 %u2013 %u2013 %u2013 %u2013 %u2013 %u2013 %u2013Non-profit institutions %u2013 %u2013 %u2013 %u2013 %u2013 %u2013 %u2013 %u2013 %u2013Households 17 685 %u2013 4 137 %u2013 %u2013 %u2013 %u2013 %u2013 %u2013Payments for capital assets %u2013 %u2013 2 066 395 395 395 295 309 323 (25.3)Buildings and other fixed structures %u2013 %u2013 2 057 %u2013 %u2013 %u2013 %u2013 %u2013 %u2013Machinery and equipment %u2013 %u2013 %u2013 %u2013 %u2013 %u2013 %u2013 %u2013 %u2013Heritage Assets %u2013 %u2013 %u2013 %u2013 %u2013 %u2013 %u2013 %u2013 %u2013Specialised military assets %u2013 %u2013 %u2013 %u2013 %u2013 %u2013 %u2013 %u2013 %u2013Biological assets %u2013 %u2013 %u2013 %u2013 %u2013 %u2013 %u2013 %u2013 %u2013Land and sub-soil assets %u2013 %u2013 %u2013 %u2013 %u2013 %u2013 %u2013 %u2013 %u2013Software and other intangible assets %u2013 %u2013 9 395 395 395 295 309 323 (25.3)Payments for financial assets %u2013 %u2013 3 661 %u2013 %u2013 %u2013 %u2013 %u2013 %u2013Total economic classification 327 587 449 289 529 495 460 592 643 583 643 583 855 298 806 121 843 805 32.92024/25Table 19 above provides the summary of payments and estimates per sub-programme and economic classification for Governance, State Capacity and Institutional Development Support. Expenditure increases from R327.587 million in 2021/22 to an estimate of R643.583 million in 2024/25 due to increased expenditure under Microsoft following centralisation as well as increased budget for Broadband project as the project is gaining momentum. In 2025/26, the budget increase by 32.9 per cent to R855.298 million mainly due to allocation made for both the Microsoft and the Broadband for the connected sites. Compensation of employees increased from R70.134 million in 2021/22 to an estimate of R81.944 million in 2024/25 due to provision made for the Improvement of Conditions of Services adjustments and provision made for the new posts. In 2025/26, the budget decreased by 2.1 per cent to R80.257 million mainly due to correct aligning of the personnel in line with new organogram structure. 124
