
Page 177 - Demo
P. 177
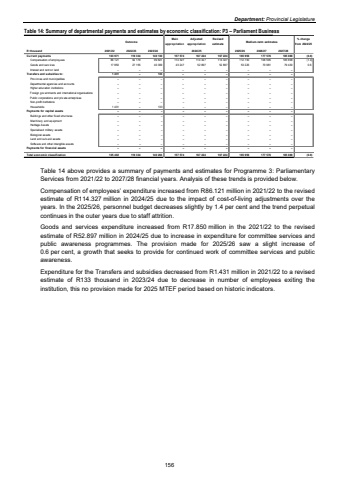
Department: Provincial LegislatureTable 14: Summary of departmental payments and estimates by economic classification: P3 %u2013 Parliament Business Outcome Main appropriationAdjusted appropriationRevised estimate Medium-term estimates % change from 2024/25R thousand 2021/22 2022/23 2023/24 2025/26 2026/27 2027/28Current payments 103 971 119 334 140 130 157 574 167 224 167 224 165 956 177 576 185 088 (0.8)Compensation of employ ees 86 121 92 179 99 821 114 327 114 327 114 327 112 730 106 595 105 658 (1.4)Goods and serv ices 17 850 27 155 40 309 43 247 52 897 52 897 53 226 70 981 79 430 0.6Interest and rent on land %u2013 %u2013 %u2013 %u2013 %u2013 %u2013 %u2013 %u2013 %u2013 Transfers and subsidies to: 1 431 %u2013 133 %u2013 %u2013 %u2013 %u2013 %u2013 %u2013 Prov inces and municipalities %u2013 %u2013 %u2013 %u2013 %u2013 %u2013 %u2013 %u2013 %u2013 Departmental agencies and accounts %u2013 %u2013 %u2013 %u2013 %u2013 %u2013 %u2013 %u2013 %u2013 Higher education institutions %u2013 %u2013 %u2013 %u2013 %u2013 %u2013 %u2013 %u2013 %u2013 Foreign gov ernments and international organisations %u2013 %u2013 %u2013 %u2013 %u2013 %u2013 %u2013 %u2013 %u2013 Public corporations and priv ate enterprises %u2013 %u2013 %u2013 %u2013 %u2013 %u2013 %u2013 %u2013 %u2013Non-profit institutions %u2013 %u2013 %u2013 %u2013 %u2013 %u2013 %u2013 %u2013 %u2013Households 1 431 %u2013 133 %u2013 %u2013 %u2013 %u2013 %u2013 %u2013Payments for capital assets %u2013 %u2013 %u2013 %u2013 %u2013 %u2013 %u2013 %u2013 %u2013Buildings and other fix ed structures %u2013 %u2013 %u2013 %u2013 %u2013 %u2013 %u2013 %u2013 %u2013Machinery and equipment %u2013 %u2013 %u2013 %u2013 %u2013 %u2013 %u2013 %u2013 %u2013Heritage Assets %u2013 %u2013 %u2013 %u2013 %u2013 %u2013 %u2013 %u2013 %u2013Specialised military assets %u2013 %u2013 %u2013 %u2013 %u2013 %u2013 %u2013 %u2013 %u2013Biological assets %u2013 %u2013 %u2013 %u2013 %u2013 %u2013 %u2013 %u2013 %u2013Land and sub-soil assets %u2013 %u2013 %u2013 %u2013 %u2013 %u2013 %u2013 %u2013 %u2013Softw are and other intangible assets %u2013 %u2013 %u2013 %u2013 %u2013 %u2013 %u2013 %u2013 %u2013Payments for financial assets %u2013 %u2013 %u2013 %u2013 %u2013 %u2013 %u2013 %u2013 %u2013Total economic classification 105 402 119 334 140 263 157 574 167 224 167 224 165 956 177 576 185 088 (0.8)2024/25 Table 14 above provides a summary of payments and estimates for Programme 3: Parliamentary Services from 2021/22 to 2027/28 financial years. Analysis of these trends is provided below. Compensation of employees%u2019 expenditure increased from R86.121 million in 2021/22 to the revised estimate of R114.327 million in 2024/25 due to the impact of cost-of-living adjustments over the years. In the 2025/26, personnel budget decreases slightly by 1.4 per cent and the trend perpetual continues in the outer years due to staff attrition. Goods and services expenditure increased from R17.850 million in the 2021/22 to the revised estimate of R52.897 million in 2024/25 due to increase in expenditure for committee services and public awareness programmes. The provision made for 2025/26 saw a slight increase of 0.6 per cent, a growth that seeks to provide for continued work of committee services and public awareness. Expenditure for the Transfers and subsidies decreased from R1.431 million in 2021/22 to a revised estimate of R133 thousand in 2023/24 due to decrease in number of employees exiting the institution, this no provision made for 2025 MTEF period based on historic indicators. 156
