
Page 181 - Demo
P. 181
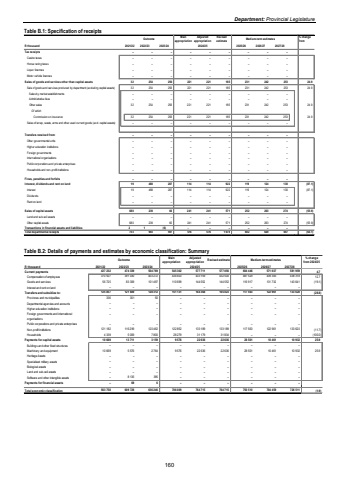
Department: Provincial LegislatureTable B.1: Specification of receipts Outcome Main appropriationAdjusted appropriationRevised estimate Medium-term estimates % change from R thousand 2021/22 2022/23 2023/24 2025/26 2026/27 2027/28Tax receipts %u2013 %u2013 %u2013 %u2013 %u2013 %u2013 %u2013 %u2013 %u2013 Casino taxes %u2013 %u2013 %u2013 %u2013 %u2013 %u2013 %u2013 %u2013 %u2013 Horse racing taxes %u2013 %u2013 %u2013 %u2013 %u2013 %u2013 %u2013 %u2013 %u2013 Liquor licences %u2013 %u2013 %u2013 %u2013 %u2013 %u2013 %u2013 %u2013 %u2013 Motor vehicle licences %u2013 %u2013 %u2013 %u2013 %u2013 %u2013 %u2013 %u2013 %u2013 Sales of goods and services other than capital assets 32 254 256 221 221 185 231 242 253 24.9Sale of goods and services produced by department (excluding capital assets) 32 254 256 221 221 185 231 242 253 24.9Sales by market establishments %u2013 %u2013 %u2013 %u2013 %u2013 %u2013 %u2013 %u2013 %u2013 Administrative fees %u2013 %u2013 %u2013 %u2013 %u2013 %u2013 %u2013 %u2013 %u2013 Other sales 32 254 256 221 221 185 231 242 253 24.9Of whichCommission on insurance 32 254 256 221 221 185 231 242 253 24.9Sales of scrap, waste, arms and other used current goods (excl. capital assets) %u2013 %u2013 %u2013 %u2013 %u2013 %u2013 %u2013 %u2013 %u2013Transfers received from: %u2013 %u2013 %u2013 %u2013 %u2013 %u2013 %u2013 %u2013 %u2013Other governmental units %u2013 %u2013 %u2013 %u2013 %u2013 %u2013 %u2013 %u2013 %u2013Higher education institutions %u2013 %u2013 %u2013 %u2013 %u2013 %u2013 %u2013 %u2013 %u2013Foreign governments %u2013 %u2013 %u2013 %u2013 %u2013 %u2013 %u2013 %u2013 %u2013International organisations %u2013 %u2013 %u2013 %u2013 %u2013 %u2013 %u2013 %u2013 %u2013Public corporations and private enterprises %u2013 %u2013 %u2013 %u2013 %u2013 %u2013 %u2013 %u2013 %u2013Households and non-profit institutions %u2013 %u2013 %u2013 %u2013 %u2013 %u2013 %u2013 %u2013 %u2013Fines, penalties and forfeits %u2013 %u2013 %u2013 %u2013 %u2013 %u2013 %u2013 %u2013 %u2013Interest, dividends and rent on land 19 488 287 114 114 922 119 124 130 (87.1)Interest 19 488 287 114 114 922 119 124 130 (87.1)Dividends %u2013 %u2013 %u2013 %u2013 %u2013 %u2013 %u2013 %u2013 %u2013Rent on land %u2013 %u2013 %u2013 %u2013 %u2013 %u2013 %u2013 %u2013 %u2013Sales of capital assets 680 239 60 241 241 571 252 263 274 (55.9)Land and sub-soil assets %u2013 %u2013 %u2013 %u2013 %u2013 %u2013 %u2013 %u2013 %u2013Other capital assets 680 239 60 241 241 571 252 263 274 (55.9)Transactions in financial assets and liabilities 2 1 (6) - %u2013 %u2013 %u2013 %u2013 %u2013Total departmental receipts 733 983 597 576 576 1 678 602 629 657 (64.1)2024/25 Table B.2: Details of payments and estimates by economic classification: Summary Outcome Main appropriationAdjusted appropriation Revised estimate Medium-term estimates % change from 2024/25R thousand 2021/22 2022/23 2023/24 2025/26 2026/27 2027/28Current payments 474 339 427 232 504 769 545 302 577 711 577 056 604 446 571 037 581 959 4.7Compensation of employees 391 030 370 507 403 272 434 603 433 159 432 504 487 529 439 305 438 318 12.7Goods and services 83 309 56 725 101 497 110 699 144 552 144 552 116 917 131 732 143 641 (19.1)Interest and rent on land %u2013 %u2013 %u2013 %u2013 %u2013 %u2013 %u2013 %u2013 %u2013 Transfers and subsidies to: 121 609 125 857 128 312 151 131 164 368 165 023 117 563 122 961 133 620 (28.8)Provinces and municipalities 301 336 50 %u2013 %u2013 %u2013 %u2013 %u2013 %u2013 Departmental agencies and accounts %u2013 %u2013 %u2013 %u2013 %u2013 %u2013 %u2013 %u2013 %u2013 Higher education institutions %u2013 %u2013 %u2013 %u2013 %u2013 %u2013 %u2013 %u2013 %u2013Foreign governments and international organisations %u2013 %u2013 %u2013 %u2013 %u2013 %u2013 %u2013 %u2013 %u2013Public corporations and private enterprises %u2013 %u2013 %u2013 %u2013 %u2013 %u2013 %u2013 %u2013 %u2013Non-profit institutions 121 182 116 299 120 462 122 852 133 189 133 189 117 563 122 961 133 620 (11.7)Households 4 339 5 009 7 800 28 279 31 179 31 834 %u2013 %u2013 %u2013 (100.0)Payments for capital assets 10 669 13 711 3 159 9 576 22 636 22 636 28 501 10 461 10 932 25.9Buildings and other fixed structures %u2013 %u2013 %u2013 %u2013 %u2013 %u2013 %u2013 %u2013 %u2013Machinery and equipment 10 669 5 576 2 764 9 576 22 636 22 636 28 501 10 461 10 932 25.9Heritage Assets %u2013 %u2013 %u2013 %u2013 %u2013 %u2013 %u2013 %u2013 %u2013Specialised military assets %u2013 %u2013 %u2013 %u2013 %u2013 %u2013 %u2013 %u2013 %u2013Biological assets %u2013 %u2013 %u2013 %u2013 %u2013 %u2013 %u2013 %u2013 %u2013Land and sub-soil assets %u2013 %u2013 %u2013 %u2013 %u2013 %u2013 %u2013 %u2013 %u2013Software and other intangible assets %u2013 8 135 395 %u2013 %u2013 %u2013 %u2013 %u2013 %u2013Payments for financial assets %u2013 69 6 %u2013 %u2013 %u2013 %u2013 %u2013 %u2013Total economic classification 563 758 609 728 636 246 706 009 764 715 764 715 750 510 704 459 726 511 (1.9)2024/25160
