
Page 178 - Demo
P. 178
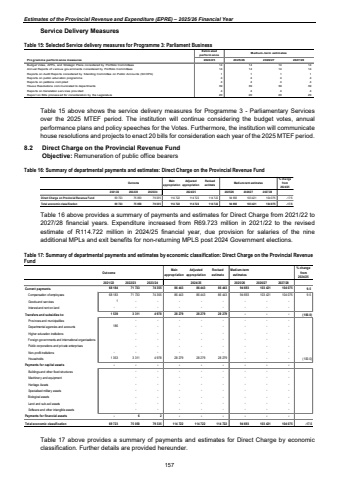
Estimates of the Provincial Revenue and Expenditure (EPRE) %u2013 2025/26 Financial YearService Delivery Measures Table 15: Selected Service delivery measures for Programme 3: Parliament Business Estimatedperformance Medium-term estimatesProgramme performance measures 2024/25 2025/26 2026/27 2027/28Budget Votes, APPs, and Strategic Plans considered by Portfolio Committees 14 14 14 14Annual Reports of v arious gov ernments considered by Portfolio Committees 14 14 14 14Reports on Audit Reports considered by Standing Committee on Public Accounts (SCOPA) 1 1 1 1Reports on public education programme 4 4 4 4Reports on petitions compiled 4 4 4 4House Resolutions communicated to departments 39 39 39 39Reports on translation serv ices prov ided 4 4 4 4Report on Bills processed for consideration by the Legislature 20 20 20 20 Table 15 above shows the service delivery measures for Programme 3 - Parliamentary Services over the 2025 MTEF period. The institution will continue considering the budget votes, annual performance plans and policy speeches for the Votes. Furthermore, the institution will communicate house resolutions and projects to enact 20 bills for consideration each year of the 2025 MTEF period. 8.2 Direct Charge on the Provincial Revenue Fund Objective: Remuneration of public office bearersTable 16: Summary of departmental payments and estimates: Direct Charge on the Provincial Revenue Fund Outcome Main appropriationAdjusted appropriationRevised estimate Medium-term estimates% change from 2024/252021/22 2022/23 2023/24 2025/26 2026/27 2027/28Direct Charge on Provincial Revenue Fund 69 723 75 050 79 335 114 722 114 722 114 722 94 693 103 421 104 075 -17.5Total economic classification 69 723 75 050 79 335 114 722 114 722 114 722 94 693 103 421 104 075 -17.52024/25Table 16 above provides a summary of payments and estimates for Direct Charge from 2021/22 to 2027/28 financial years. Expenditure increased from R69.723 million in 2021/22 to the revised estimate of R114.722 million in 2024/25 financial year, due provision for salaries of the nine additional MPLs and exit benefits for non-returning MPLS post 2024 Government elections. Table 17: Summary of departmental payments and estimates by economic classification: Direct Charge on the Provincial Revenue Fund Outcome Main appropriationAdjusted appropriationRevised estimateMedium-term estimates% change from 2024/252021/22 2022/23 2023/24 2025/26 2026/27 2027/28Current payments 68 184 71 733 74 355 86 443 86 443 86 443 94 693 103 421 104 075 9.5Compensation of employees 68 183 71 733 74 355 86 443 86 443 86 443 94 693 103 421 104 075 9.5Goods and services 1 - - - - - - - - Interest and rent on land - - - - - - - - - Transfers and subsidies to: 1 539 3 311 4 978 28 279 28 279 28 279 - - - (100.0)Provinces and municipalities - - - - - - - - Departmental agencies and accounts 186 - - - - - - - - Higher education institutions - - - - - - - - Foreign governments and international organisations - - - - - - - - Public corporations and private enterprises - - - - - - - - Non-profit institutions - - - - - - - - - Households 1 353 3 311 4 978 28 279 28 279 28 279 - - - (100.0)Payments for capital assets - - - - - - - - - Buildings and other fixed structures - - - - - - - - Machinery and equipment - - - - - - - - Heritage Assets - - - - - - - - Specialised military assets - - - - - - - - Biological assets - - - - - - - - Land and sub-soil assets - - - - - - - - Software and other intangible assets - - - - - - - - Payments for financial assets - 6 2 - - - - - - Total economic classification 69 723 75 050 79 335 114 722 114 722 114 722 94 693 103 421 104 075 -17.52024/25 Table 17 above provides a summary of payments and estimates for Direct Charge by economic classification. Further details are provided hereunder. 157
