
Page 203 - Demo
P. 203
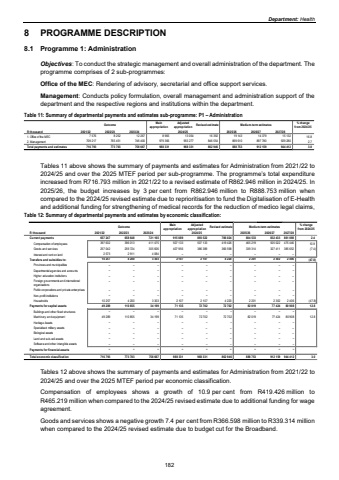
Department: Health8 PROGRAMME DESCRIPTION 8.1 Programme 1: Administration Objectives: To conduct the strategic management and overall administration of the department. The programme comprises of 2 sub-programmes: Office of the MEC: Rendering of advisory, secretarial and office support services. Management: Conducts policy formulation, overall management and administration support of the department and the respective regions and institutions within the department. Table 11: Summary of departmental payments and estimates sub-programme: P1 %u2013 Administration Outcome Main appropriationAdjusted appropriation Revised estimate Medium-term estimates % change from 2024/25R thousand 2021/22 2022/23 2023/24 2025/26 2026/27 2027/281. Office of the MEC 8 252 7 576 12 267 8 965 13 054 16 392 19 143 14 379 15 132 16.82. Management 709 217 765 451 746 400 979 366 955 277 846 554 869 610 897 780 929 280 2.7Total payments and estimates 716 793 773 703 758 667 988 331 968 331 862 946 888 753 912 159 944 412 3.02024/25Tables 11 above shows the summary of payments and estimates for Administration from 2021/22 to 2024/25 and over the 2025 MTEF period per sub-programme. The programme%u2019s total expenditure increased from R716.793 million in 2021/22 to a revised estimate of R862.946 million in 2024/25. In 2025/26, the budget increases by 3 per cent from R862.946 million to R888.753 million when compared to the 2024/25 revised estimate due to reprioritisation to fund the Digitalisation of E-Health and additional funding for strengthening of medical records for the reduction of medico legal claims, Table 12: Summary of departmental payments and estimates by economic classification:Outcome Main appropriationAdjusted appropriation Revised estimate Medium-term estimates % change from 2024/25R thousand 2021/22 2022/23 2023/24 2025/26 2026/27 2027/28Current payments 657 247 658 648 721 165 915 089 893 522 786 024 804 533 861 098 832 433 2.4Compensation of employees 397 632 396 013 411 475 507 133 507 133 419 426 465 219 475 446 505 022 10.9Goods and services 257 042 259 724 305 606 407 956 386 389 366 598 339 314 385 652 327 411 (7.4)Interest and rent on land 2 573 2 911 4 084 %u2013 %u2013 %u2013 %u2013 %u2013 %u2013Transfers and subsidies to: 10 257 4 200 3 303 2 107 2 107 4 220 2 201 2 406 2 302 (47.8)Provinces and municipalities %u2013 %u2013 %u2013 %u2013 %u2013 %u2013 %u2013 %u2013 %u2013Departmental agencies and accounts %u2013 %u2013 %u2013 %u2013 %u2013 %u2013 %u2013 %u2013 %u2013Higher education institutions %u2013 %u2013 %u2013 %u2013 %u2013 %u2013 %u2013 %u2013 %u2013Foreign governments and international organisations %u2013 %u2013 %u2013 %u2013 %u2013 %u2013 %u2013 %u2013 %u2013Public corporations and private enterprises %u2013 %u2013 %u2013 %u2013 %u2013 %u2013 %u2013 %u2013 %u2013Non-profit institutions %u2013 %u2013 %u2013 %u2013 %u2013 %u2013 %u2013 %u2013 %u2013Households 10 257 4 200 3 303 2 107 2 107 4 220 2 201 2 406 2 302 (47.8)Payments for capital assets 49 289 110 855 34 199 71 135 72 702 72 702 82 019 80 908 77 424 12.8Buildings and other fixed structures %u2013 %u2013 %u2013 %u2013 %u2013 %u2013 %u2013 %u2013 %u2013Machinery and equipment 49 289 110 855 34 199 71 135 72 702 72 702 82 019 80 908 77 424 12.8Heritage Assets %u2013 %u2013 %u2013 %u2013 %u2013 %u2013 %u2013 %u2013 %u2013Specialised military assets %u2013 %u2013 %u2013 %u2013 %u2013 %u2013 %u2013 %u2013 %u2013Biological assets %u2013 %u2013 %u2013 %u2013 %u2013 %u2013 %u2013 %u2013 %u2013Land and sub-soil assets %u2013 %u2013 %u2013 %u2013 %u2013 %u2013 %u2013 %u2013 %u2013Software and other intangible assets %u2013 %u2013 %u2013 %u2013 %u2013 %u2013 %u2013 %u2013 %u2013Payments for financial assets %u2013 %u2013 %u2013 %u2013 %u2013 %u2013 %u2013 %u2013 %u2013Total economic classification 716 793 773 703 758 667 988 331 968 331 862 946 888 753 944 412 912 159 3.02024/25Tables 12 above shows the summary of payments and estimates for Administration from 2021/22 to 2024/25 and over the 2025 MTEF period per economic classification. Compensation of employees shows a growth of 10.9 per cent from R419.426 million to R465.219 million when compared to the 2024/25 revised estimate due to additional funding for wage agreement. Goods and services shows a negative growth 7.4 per cent from R366.598 million to R339.314 million when compared to the 2024/25 revised estimate due to budget cut for the Broadband. 182
