
Page 237 - Demo
P. 237
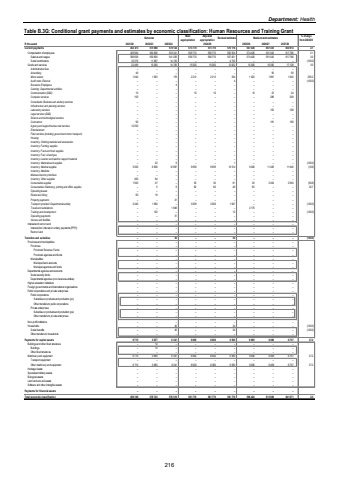
Department: HealthTable B.3G: Conditional grant payments and estimates by economic classification: Human Resources and Training Grant Outcome Main appropriationAdjusted appropriation Revised estimate Medium-term estimates % change from 2024/25R thousand 2021/22 2022/23 2023/24 2025/26 2026/27 2027/28Current payments 452 473 573 066 570 124 573 770 573 770 575 176 587 426 607 433 634 914 2.1Compensation of employees 429 984 562 806 555 341 558 770 558 770 562 554 574 426 591 043 617 786 2.1Salaries and wages 396 608 550 809 541 206 558 770 558 770 557 821 574 426 591 043 617 786 3.0Social contributions 33 376 11 997 14 135 %u2013 %u2013 4 733 %u2013 %u2013 %u2013 (100.0)Goods and services 22 489 10 260 14 783 15 000 15 000 12 622 13 000 16 390 17 128 3.0Administrative fees %u2013 %u2013 %u2013 %u2013 %u2013 %u2013 %u2013 %u2013 %u2013Advertising 49 %u2013 %u2013 %u2013 %u2013 %u2013 %u2013 56 59Minor assets 1 040 1 563 176 2 213 2 213 334 1 320 1 861 1 945 295.2Audit costs: External %u2013 %u2013 %u2013 %u2013 %u2013 4 %u2013 %u2013 %u2013 (100.0)Bursaries: Employees %u2013 %u2013 4 %u2013 %u2013 %u2013 %u2013 %u2013 %u2013Catering: Departmental activities %u2013 %u2013 %u2013 %u2013 %u2013 %u2013 %u2013 %u2013 %u2013Communication (G&S) 10 %u2013 %u2013 10 10 %u2013 10 23 24Computer services 150 %u2013 %u2013 %u2013 %u2013 %u2013 %u2013 286 299Consultants: Business and advisory services %u2013 %u2013 %u2013 %u2013 %u2013 %u2013 %u2013 %u2013 %u2013Infrastructure and planning services %u2013 %u2013 %u2013 %u2013 %u2013 %u2013 %u2013 %u2013 %u2013Laboratory services %u2013 %u2013 %u2013 %u2013 %u2013 %u2013 %u2013 103 108Legal services (G&S) %u2013 %u2013 %u2013 %u2013 %u2013 %u2013 %u2013 %u2013 %u2013Science and technological services %u2013 %u2013 %u2013 %u2013 %u2013 %u2013 %u2013 %u2013 %u2013Contractors 90 %u2013 %u2013 %u2013 %u2013 %u2013 %u2013 181 189Agency and support/outsourced services 12 250 %u2013 %u2013 %u2013 %u2013 %u2013 %u2013 %u2013 %u2013Entertainment %u2013 %u2013 %u2013 %u2013 %u2013 %u2013 %u2013 %u2013 %u2013Fleet services (including government motor transport) %u2013 %u2013 %u2013 %u2013 %u2013 %u2013 %u2013 %u2013 %u2013Housing %u2013 %u2013 %u2013 %u2013 %u2013 %u2013 %u2013 %u2013 %u2013Inventory: Clothing material and accessories %u2013 %u2013 %u2013 %u2013 %u2013 %u2013 %u2013 %u2013 %u2013Inventory: Farming supplies %u2013 %u2013 %u2013 %u2013 %u2013 %u2013 %u2013 %u2013 %u2013Inventory: Food and food supplies %u2013 %u2013 %u2013 %u2013 %u2013 %u2013 %u2013 %u2013 %u2013Inventory: Fuel, oil and gas %u2013 %u2013 %u2013 %u2013 %u2013 %u2013 %u2013 %u2013 %u2013Inventory: Learner and teacher support material %u2013 %u2013 %u2013 %u2013 %u2013 %u2013 %u2013 %u2013 %u2013Inventory: Materials and supplies %u2013 22 9 %u2013 %u2013 1 %u2013 %u2013 %u2013 (100.0)Inventory: Medical supplies 3 500 6 838 12 687 9 656 9 656 10 514 9 400 11 426 11 940 (10.6)Inventory: Medicine %u2013 %u2013 %u2013 %u2013 %u2013 %u2013 %u2013 %u2013 %u2013Medsas inventory interface %u2013 %u2013 %u2013 %u2013 %u2013 %u2013 %u2013 %u2013 %u2013Inventory: Other supplies 400 84 %u2013 %u2013 %u2013 %u2013 %u2013 %u2013 %u2013Consumable supplies 1 500 47 %u2013 30 30 61 30 2 454 2 564 (50.8)Consumables: Stationery, printing and office supplies %u2013 5 9 82 82 49 65 %u2013 %u2013 32.7Operating leases %u2013 %u2013 %u2013 %u2013 %u2013 %u2013 %u2013 %u2013 %u2013Rental and hiring 60 19 %u2013 %u2013 %u2013 %u2013 %u2013 %u2013 %u2013Property payments %u2013 %u2013 21 %u2013 %u2013 %u2013 %u2013 %u2013 %u2013Transport provided: Departmental activity 3 440 1 560 %u2013 3 009 3 009 1 647 %u2013 %u2013 %u2013 (100.0)Travel and subsistence %u2013 %u2013 1 846 %u2013 %u2013 %u2013 2 175 %u2013 %u2013Training and development %u2013 122 %u2013 %u2013 %u2013 12 %u2013 %u2013 %u2013 (100.0)Operating payments %u2013 %u2013 31 %u2013 %u2013 %u2013 %u2013 %u2013 %u2013Venues and facilities %u2013 %u2013 %u2013 %u2013 %u2013 %u2013 %u2013 %u2013 %u2013Interest and rent on land %u2013 %u2013 %u2013 %u2013 %u2013 %u2013 %u2013 %u2013 %u2013Interest (Incl. interest on unitary payments (PPP)) %u2013 %u2013 %u2013 %u2013 %u2013 %u2013 %u2013 %u2013 %u2013Rent on land %u2013 %u2013 %u2013 %u2013 %u2013 %u2013 %u2013 %u2013 %u2013Transfers and subsidies %u2013 %u2013 45 %u2013 %u2013 34 %u2013 %u2013 %u2013 (100.0)Provinces and municipalities %u2013 %u2013 %u2013 %u2013 %u2013 %u2013 %u2013 %u2013 %u2013Provinces %u2013 %u2013 %u2013 %u2013 %u2013 %u2013 %u2013 %u2013 %u2013Provincial Revenue Funds %u2013 %u2013 %u2013 %u2013 %u2013 %u2013 %u2013 %u2013 %u2013Provincial agencies and funds %u2013 %u2013 %u2013 %u2013 %u2013 %u2013 %u2013 %u2013 %u2013Municipalities %u2013 %u2013 %u2013 %u2013 %u2013 %u2013 %u2013 %u2013 %u2013Municipal bank accounts %u2013 %u2013 %u2013 %u2013 %u2013 %u2013 %u2013 %u2013 %u2013Municipal agencies and funds %u2013 %u2013 %u2013 %u2013 %u2013 %u2013 %u2013 %u2013 %u2013Departmental agencies and accounts %u2013 %u2013 %u2013 %u2013 %u2013 %u2013 %u2013 %u2013 %u2013Social security funds %u2013 %u2013 %u2013 %u2013 %u2013 %u2013 %u2013 %u2013 %u2013Departmental agencies (non-business entities) %u2013 %u2013 %u2013 %u2013 %u2013 %u2013 %u2013 %u2013 %u2013Higher education institutions %u2013 %u2013 %u2013 %u2013 %u2013 %u2013 %u2013 %u2013 %u2013Foreign governments and international organisations %u2013 %u2013 %u2013 %u2013 %u2013 %u2013 %u2013 %u2013 %u2013Public corporations and private enterprises %u2013 %u2013 %u2013 %u2013 %u2013 %u2013 %u2013 %u2013 %u2013Public corporations %u2013 %u2013 %u2013 %u2013 %u2013 %u2013 %u2013 %u2013 %u2013Subsidies on products and production (pc) %u2013 %u2013 %u2013 %u2013 %u2013 %u2013 %u2013 %u2013 %u2013Other transfers to public corporations %u2013 %u2013 %u2013 %u2013 %u2013 %u2013 %u2013 %u2013 %u2013Private enterprises %u2013 %u2013 %u2013 %u2013 %u2013 %u2013 %u2013 %u2013 %u2013Subsidies on products and production (pe) %u2013 %u2013 %u2013 %u2013 %u2013 %u2013 %u2013 %u2013 %u2013Other transfers to private enterprises %u2013 %u2013 %u2013 %u2013 %u2013 %u2013 %u2013 %u2013 %u2013Non-profit institutions %u2013 %u2013 %u2013 %u2013 %u2013 %u2013 %u2013 %u2013 %u2013Households %u2013 %u2013 45 %u2013 %u2013 34 %u2013 %u2013 %u2013 (100.0)Social benefits %u2013 %u2013 45 %u2013 %u2013 34 %u2013 %u2013 %u2013 (100.0)Other transfers to households %u2013 %u2013 %u2013 %u2013 %u2013 %u2013 %u2013 %u2013 %u2013Payments for capital assets 6 715 5 677 6 341 8 000 8 000 6 560 9 000 6 466 6 757 37.2Buildings and other fixed structures %u2013 12 %u2013 %u2013 %u2013 %u2013 %u2013 %u2013 %u2013Buildings %u2013 12 %u2013 %u2013 %u2013 %u2013 %u2013 %u2013 %u2013Other fixed structures %u2013 %u2013 %u2013 %u2013 %u2013 %u2013 %u2013 %u2013 %u2013Machinery and equipment 6 715 5 665 6 341 8 000 8 000 6 560 9 000 6 466 6 757 37.2Transport equipment %u2013 %u2013 %u2013 %u2013 %u2013 %u2013 %u2013 %u2013 %u2013Other machinery and equipment 6 715 5 665 6 341 8 000 8 000 6 560 9 000 6 466 6 757 37.2Heritage Assets %u2013 %u2013 %u2013 %u2013 %u2013 %u2013 %u2013 %u2013 %u2013Specialised military assets %u2013 %u2013 %u2013 %u2013 %u2013 %u2013 %u2013 %u2013 %u2013Biological assets %u2013 %u2013 %u2013 %u2013 %u2013 %u2013 %u2013 %u2013 %u2013Land and sub-soil assets %u2013 %u2013 %u2013 %u2013 %u2013 %u2013 %u2013 %u2013 %u2013Software and other intangible assets %u2013 %u2013 %u2013 %u2013 %u2013 %u2013 %u2013 %u2013 %u2013Payments for financial assets %u2013 %u2013 %u2013 %u2013 %u2013 %u2013 %u2013 %u2013 %u2013Total economic classification 459 188 578 743 576 510 581 770 581 770 581 770 596 426 613 899 641 671 2.52024/25216
