
Page 232 - Demo
P. 232
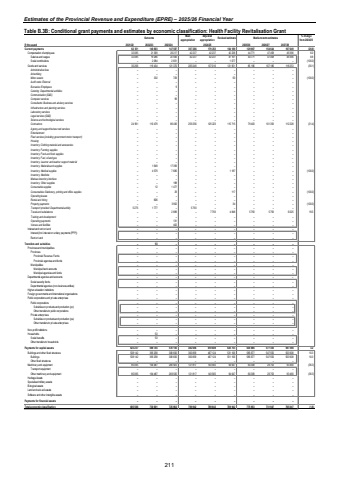
Estimates of the Provincial Revenue and Expenditure (EPRE) %u2013 2025/26 Financial YearTable B.3B: Conditional grant payments and estimates by economic classification: Health Facility Revitalisation Grant Outcome Main appropriationAdjusted appropriation Revised estimate Medium-term estimates % change from 2024/25R thousand 2021/22 2022/23 2023/24 2025/26 2026/27 2027/28Current payments 62 351 140 803 147 587 307 286 179 253 164 189 129 967 154 644 167 649 (20.8)Compensation of employees 32 085 21 369 26 217 42 237 42 237 42 238 44 771 47 458 49 396 6.0Salaries and wages 32 085 19 286 23 566 42 237 42 237 41 161 44 771 47 458 49 396 8.8Social contributions %u2013 2 084 2 651 %u2013 %u2013 1 077 %u2013 %u2013 %u2013 (100.0)Goods and services 30 266 119 434 121 370 265 049 137 016 121 951 85 196 107 186 118 253 (30.1)Administrative fees %u2013 %u2013 %u2013 %u2013 %u2013 %u2013 %u2013 %u2013 %u2013Advertising %u2013 %u2013 %u2013 %u2013 %u2013 %u2013 %u2013 %u2013 %u2013Minor assets %u2013 332 729 %u2013 %u2013 50 %u2013 %u2013 %u2013 (100.0)Audit costs: External %u2013 %u2013 %u2013 %u2013 %u2013 %u2013 %u2013 %u2013 %u2013Bursaries: Employees %u2013 %u2013 9 %u2013 %u2013 %u2013 %u2013 %u2013 %u2013Catering: Departmental activities %u2013 %u2013 %u2013 %u2013 %u2013 %u2013 %u2013 %u2013 %u2013Communication (G&S) %u2013 %u2013 %u2013 %u2013 %u2013 %u2013 %u2013 %u2013 %u2013Computer services %u2013 %u2013 99 %u2013 %u2013 %u2013 %u2013 %u2013 %u2013Consultants: Business and advisory services %u2013 %u2013 %u2013 %u2013 %u2013 %u2013 %u2013 %u2013 %u2013Infrastructure and planning services %u2013 %u2013 %u2013 %u2013 %u2013 %u2013 %u2013 %u2013 %u2013Laboratory services %u2013 %u2013 %u2013 %u2013 %u2013 %u2013 %u2013 %u2013 %u2013Legal services (G&S) %u2013 %u2013 %u2013 %u2013 %u2013 %u2013 %u2013 %u2013 %u2013Science and technological services %u2013 %u2013 %u2013 %u2013 %u2013 %u2013 %u2013 %u2013 %u2013Contractors 24 991 110 479 86 436 259 256 129 223 115 715 79 403 101 393 112 228 (31.4)Agency and support/outsourced services %u2013 %u2013 %u2013 %u2013 %u2013 %u2013 %u2013 %u2013 %u2013Entertainment %u2013 %u2013 %u2013 %u2013 %u2013 %u2013 %u2013 %u2013 %u2013Fleet services (including government motor transport) %u2013 %u2013 %u2013 %u2013 %u2013 %u2013 %u2013 %u2013 %u2013Housing %u2013 %u2013 %u2013 %u2013 %u2013 %u2013 %u2013 %u2013 %u2013Inventory: Clothing material and accessories %u2013 %u2013 %u2013 %u2013 %u2013 %u2013 %u2013 %u2013 %u2013Inventory: Farming supplies %u2013 %u2013 %u2013 %u2013 %u2013 %u2013 %u2013 %u2013 %u2013Inventory: Food and food supplies %u2013 %u2013 %u2013 %u2013 %u2013 %u2013 %u2013 %u2013 %u2013Inventory: Fuel, oil and gas %u2013 %u2013 %u2013 %u2013 %u2013 %u2013 %u2013 %u2013 %u2013Inventory: Learner and teacher support material %u2013 %u2013 %u2013 %u2013 %u2013 %u2013 %u2013 %u2013 %u2013Inventory: Materials and supplies %u2013 1 649 17 399 %u2013 %u2013 %u2013 %u2013 %u2013 %u2013Inventory: Medical supplies %u2013 4 579 7 680 %u2013 %u2013 1 187 %u2013 %u2013 %u2013 (100.0)Inventory: Medicine %u2013 %u2013 %u2013 %u2013 %u2013 %u2013 %u2013 %u2013 %u2013Medsas inventory interface %u2013 %u2013 %u2013 %u2013 %u2013 %u2013 %u2013 %u2013 %u2013Inventory: Other supplies %u2013 %u2013 188 %u2013 %u2013 %u2013 %u2013 %u2013 %u2013Consumable supplies %u2013 12 1 477 %u2013 %u2013 %u2013 %u2013 %u2013 %u2013Consumables: Stationery, printing and office supplies %u2013 %u2013 29 %u2013 %u2013 117 %u2013 %u2013 %u2013 (100.0)Operating leases %u2013 %u2013 %u2013 %u2013 %u2013 %u2013 %u2013 %u2013 %u2013Rental and hiring %u2013 606 %u2013 %u2013 %u2013 %u2013 %u2013 %u2013 %u2013Property payments %u2013 %u2013 3 902 %u2013 %u2013 34 %u2013 %u2013 %u2013 (100.0)Transport provided: Departmental activity 5 275 1 777 %u2013 5 793 %u2013 %u2013 %u2013 %u2013 %u2013Travel and subsistence %u2013 %u2013 2 889 %u2013 7 793 4 848 5 793 5 793 6 025 19.5Training and development %u2013 %u2013 %u2013 %u2013 %u2013 %u2013 %u2013 %u2013 %u2013Operating payments %u2013 %u2013 131 %u2013 %u2013 %u2013 %u2013 %u2013 %u2013Venues and facilities %u2013 %u2013 402 %u2013 %u2013 %u2013 %u2013 %u2013 %u2013Interest and rent on land %u2013 %u2013 %u2013 %u2013 %u2013 %u2013 %u2013 %u2013 %u2013Interest (Incl. interest on unitary payments (PPP)) %u2013 %u2013 %u2013 %u2013 %u2013 %u2013 %u2013 %u2013 %u2013Rent on land %u2013 %u2013 %u2013 %u2013 %u2013 %u2013 %u2013 %u2013 %u2013Transfers and subsidies %u2013 53 %u2013 %u2013 %u2013 %u2013 %u2013 %u2013 %u2013Provinces and municipalities %u2013 %u2013 %u2013 %u2013 %u2013 %u2013 %u2013 %u2013 %u2013Provinces %u2013 %u2013 %u2013 %u2013 %u2013 %u2013 %u2013 %u2013 %u2013Provincial Revenue Funds %u2013 %u2013 %u2013 %u2013 %u2013 %u2013 %u2013 %u2013 %u2013Provincial agencies and funds %u2013 %u2013 %u2013 %u2013 %u2013 %u2013 %u2013 %u2013 %u2013Municipalities %u2013 %u2013 %u2013 %u2013 %u2013 %u2013 %u2013 %u2013 %u2013Municipal bank accounts %u2013 %u2013 %u2013 %u2013 %u2013 %u2013 %u2013 %u2013 %u2013Municipal agencies and funds %u2013 %u2013 %u2013 %u2013 %u2013 %u2013 %u2013 %u2013 %u2013Departmental agencies and accounts %u2013 %u2013 %u2013 %u2013 %u2013 %u2013 %u2013 %u2013 %u2013Social security funds %u2013 %u2013 %u2013 %u2013 %u2013 %u2013 %u2013 %u2013 %u2013Departmental agencies (non-business entities) %u2013 %u2013 %u2013 %u2013 %u2013 %u2013 %u2013 %u2013 %u2013Higher education institutions %u2013 %u2013 %u2013 %u2013 %u2013 %u2013 %u2013 %u2013 %u2013Foreign governments and international organisations %u2013 %u2013 %u2013 %u2013 %u2013 %u2013 %u2013 %u2013 %u2013Public corporations and private enterprises %u2013 %u2013 %u2013 %u2013 %u2013 %u2013 %u2013 %u2013 %u2013Public corporations %u2013 %u2013 %u2013 %u2013 %u2013 %u2013 %u2013 %u2013 %u2013Subsidies on products and production (pc) %u2013 %u2013 %u2013 %u2013 %u2013 %u2013 %u2013 %u2013 %u2013Other transfers to public corporations %u2013 %u2013 %u2013 %u2013 %u2013 %u2013 %u2013 %u2013 %u2013Private enterprises %u2013 %u2013 %u2013 %u2013 %u2013 %u2013 %u2013 %u2013 %u2013Subsidies on products and production (pe) %u2013 %u2013 %u2013 %u2013 %u2013 %u2013 %u2013 %u2013 %u2013Other transfers to private enterprises %u2013 %u2013 %u2013 %u2013 %u2013 %u2013 %u2013 %u2013 %u2013Non-profit institutions %u2013 %u2013 %u2013 %u2013 %u2013 %u2013 %u2013 %u2013 %u2013Households %u2013 53 %u2013 %u2013 %u2013 %u2013 %u2013 %u2013 %u2013Social benefits %u2013 53 %u2013 %u2013 %u2013 %u2013 %u2013 %u2013 %u2013Other transfers to households %u2013 %u2013 %u2013 %u2013 %u2013 %u2013 %u2013 %u2013 %u2013Payments for capital assets 623 237 589 745 578 105 482 656 610 689 625 753 645 986 577 303 597 398 3.2Buildings and other fixed structures 538 142 395 258 308 600 360 839 467 124 531 106 585 677 547 550 503 908 10.3Buildings 538 142 395 258 308 600 360 839 467 124 531 106 585 677 547 550 503 908 10.3Other fixed structures %u2013 %u2013 %u2013 %u2013 %u2013 %u2013 %u2013 %u2013 %u2013Machinery and equipment 85 095 194 487 269 505 121 817 143 565 94 647 60 309 29 753 93 490 (36.3)Transport equipment %u2013 %u2013 %u2013 %u2013 %u2013 %u2013 %u2013 %u2013 %u2013Other machinery and equipment 85 095 194 487 269 505 121 817 143 565 94 647 60 309 29 753 93 490 (36.3)Heritage Assets %u2013 %u2013 %u2013 %u2013 %u2013 %u2013 %u2013 %u2013 %u2013Specialised military assets %u2013 %u2013 %u2013 %u2013 %u2013 %u2013 %u2013 %u2013 %u2013Biological assets %u2013 %u2013 %u2013 %u2013 %u2013 %u2013 %u2013 %u2013 %u2013Land and sub-soil assets %u2013 %u2013 %u2013 %u2013 %u2013 %u2013 %u2013 %u2013 %u2013Software and other intangible assets %u2013 %u2013 %u2013 %u2013 %u2013 %u2013 %u2013 %u2013 %u2013Payments for financial assets %u2013 %u2013 %u2013 %u2013 %u2013 %u2013 %u2013 %u2013 %u2013Total economic classification 685 588 730 601 725 692 789 942 789 942 789 942 775 953 731 947 765 047 (1.8)2024/25211
