
Page 231 - Demo
P. 231
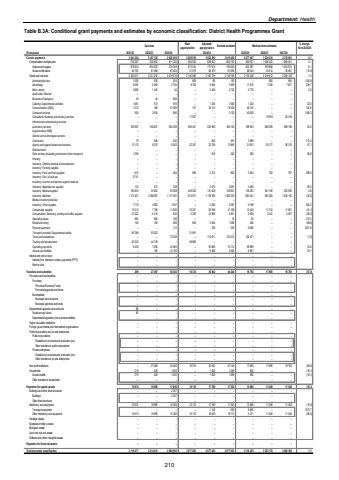
Department: HealthTable B.3A: Conditional grant payments and estimates by economic classification: District Health Programmes Grant Outcome Main appropriationAdjusted appropriation Revised estimate Medium-term estimates % change from 2024/25R thousand 2021/22 2022/23 2023/24 2025/26 2026/27 2027/28Current payments 3 167 125 3 041 204 2 830 810 3 050 519 3 022 292 3 015 456 3 077 467 3 224 234 3 370 061 2.1Compensation of employees 735 587 935 893 811 234 904 933 838 553 865 720 900 931 1 005 322 1 060 941 4.1Salaries and wages 678 834 854 625 724 209 873 354 773 974 784 625 832 387 970 808 1 024 874 6.1Social contributions 56 753 81 268 87 025 31 579 64 579 81 095 68 544 34 514 36 067 (15.5)Goods and services 2 305 617 2 231 232 2 019 576 2 145 586 2 183 739 2 149 736 2 176 536 2 218 912 2 309 120 1.2Administrative fees 930 1 200 254 608 80 165 %u2013 664 694 (100.0)Advertising 2 560 9 093 2 794 8 728 9 845 3 509 11 570 7 538 7 877 229.7Minor assets 1 445 3 808 32 %u2013 5 408 2 722 2 776 %u2013 %u2013 2.0Audit costs: External %u2013 %u2013 %u2013 %u2013 %u2013 %u2013 %u2013 %u2013 %u2013Bursaries: Employees 45 44 285 %u2013 %u2013 %u2013 %u2013 %u2013 %u2013Catering: Departmental activities 1 081 513 976 %u2013 1 326 1 082 1 320 %u2013 %u2013 22.0Communication (G&S) 1 372 186 57 659 731 25 312 18 329 40 316 %u2013 %u2013 120.0Computer services 500 2 934 890 %u2013 %u2013 3 125 40 000 %u2013 %u2013 1180.2Consultants: Business and advisory services %u2013 %u2013 %u2013 17 927 %u2013 %u2013 %u2013 19 592 20 474Infrastructure and planning services %u2013 %u2013 %u2013 %u2013 %u2013 %u2013 %u2013 %u2013 %u2013Laboratory services 709 087 768 827 594 229 596 451 535 908 496 102 789 933 669 309 689 785 59.2Legal services (G&S) %u2013 %u2013 %u2013 %u2013 %u2013 %u2013 %u2013 %u2013 %u2013Science and technological services %u2013 %u2013 %u2013 %u2013 %u2013 %u2013 %u2013 %u2013 %u2013Contractors 79 948 420 %u2013 600 491 3 989 %u2013 %u2013 712.4Agency and support/outsourced services 13 170 6 070 8 303 22 307 22 709 13 894 21 831 25 177 26 310 57.1Entertainment %u2013 %u2013 %u2013 %u2013 %u2013 %u2013 %u2013 %u2013 %u2013Fleet services (including government motor transport) 1 390 %u2013 %u2013 %u2013 816 262 500 %u2013 %u2013 90.8Housing %u2013 %u2013 %u2013 %u2013 %u2013 %u2013 %u2013 %u2013 %u2013Inventory: Clothing material and accessories %u2013 %u2013 %u2013 %u2013 %u2013 %u2013 %u2013 %u2013 %u2013Inventory: Farming supplies %u2013 %u2013 %u2013 %u2013 %u2013 %u2013 %u2013 %u2013 %u2013Inventory: Food and food supplies 615 %u2013 484 698 2 312 820 3 264 763 797 298.0Inventory: Fuel, oil and gas 2 741 %u2013 %u2013 %u2013 %u2013 %u2013 %u2013 %u2013 %u2013Inventory: Learner and teacher support material %u2013 %u2013 %u2013 %u2013 %u2013 %u2013 %u2013 %u2013 %u2013Inventory: Materials and supplies 132 573 358 %u2013 2 672 2 691 3 480 %u2013 %u2013 29.3Inventory: Medical supplies 194 835 33 602 93 638 440 225 131 008 128 821 135 053 501 105 523 655 4.8Inventory: Medicine 1 173 427 1 288 097 1 117 091 972 971 1 178 290 1 262 576 881 041 981 005 1 025 150 (30.2)Medsas inventory interface %u2013 %u2013 %u2013 %u2013 %u2013 %u2013 %u2013 %u2013 %u2013Inventory: Other supplies 1 770 4 902 1 057 %u2013 5 290 2 287 9 198 %u2013 %u2013 302.2Consumable supplies 15 312 7 185 11 583 10 351 29 498 21 109 12 442 11 312 11 821 (41.1)Consumables: Stationery, printing and office supplies 27 422 6 419 842 2 239 12 856 5 951 2 056 2 447 2 557 (65.5)Operating leases 850 900 185 %u2013 %u2013 16 50 %u2013 %u2013 212.5Rental and hiring 150 190 666 694 2 064 1 268 400 %u2013 %u2013 (68.5)Property payments %u2013 %u2013 112 %u2013 709 329 8 000 %u2013 %u2013 2331.6Transport provided: Departmental activity 85 786 53 023 %u2013 21 991 %u2013 %u2013 %u2013 %u2013 %u2013Travel and subsistence %u2013 %u2013 73 329 114 671 %u2013 103 513 102 471 %u2013 %u2013 (1.0)Training and development 55 322 44 139 %u2013 49 665 %u2013 %u2013 %u2013 %u2013 %u2013Operating payments 6 430 7 550 43 664 %u2013 92 885 75 112 99 889 %u2013 %u2013 33.0Venues and facilities %u2013 195 10 725 %u2013 9 480 5 562 6 957 %u2013 %u2013 25.1Interest and rent on land %u2013 %u2013 %u2013 %u2013 %u2013 %u2013 %u2013 %u2013 %u2013Interest (Incl. interest on unitary payments (PPP)) %u2013 %u2013 %u2013 %u2013 %u2013 %u2013 %u2013 %u2013 %u2013Rent on land %u2013 %u2013 %u2013 %u2013 %u2013 %u2013 %u2013 %u2013 %u2013Transfers and subsidies 299 27 497 36 543 16 374 36 942 44 244 18 792 17 895 18 700 (57.5)Provinces and municipalities %u2013 %u2013 %u2013 %u2013 %u2013 %u2013 %u2013 %u2013 %u2013Provinces %u2013 %u2013 %u2013 %u2013 %u2013 %u2013 %u2013 %u2013 %u2013Provincial Revenue Funds %u2013 %u2013 %u2013 %u2013 %u2013 %u2013 %u2013 %u2013 %u2013Provincial agencies and funds %u2013 %u2013 %u2013 %u2013 %u2013 %u2013 %u2013 %u2013 %u2013Municipalities %u2013 %u2013 %u2013 %u2013 %u2013 %u2013 %u2013 %u2013 %u2013Municipal bank accounts %u2013 %u2013 %u2013 %u2013 %u2013 %u2013 %u2013 %u2013 %u2013Municipal agencies and funds %u2013 %u2013 %u2013 %u2013 %u2013 %u2013 %u2013 %u2013 %u2013Departmental agencies and accounts 80 %u2013 %u2013 %u2013 %u2013 %u2013 %u2013 %u2013 %u2013Social security funds 80 %u2013 %u2013 %u2013 %u2013 %u2013 %u2013 %u2013 %u2013Departmental agencies (non-business entities) %u2013 %u2013 %u2013 %u2013 %u2013 %u2013 %u2013 %u2013 %u2013Higher education institutions %u2013 %u2013 %u2013 %u2013 %u2013 %u2013 %u2013 %u2013 %u2013Foreign governments and international organisations %u2013 %u2013 %u2013 %u2013 %u2013 %u2013 %u2013 %u2013 %u2013Public corporations and private enterprises %u2013 %u2013 %u2013 %u2013 %u2013 %u2013 %u2013 %u2013 %u2013Public corporations %u2013 %u2013 %u2013 %u2013 %u2013 %u2013 %u2013 %u2013 %u2013Subsidies on products and production (pc) %u2013 %u2013 %u2013 %u2013 %u2013 %u2013 %u2013 %u2013 %u2013Other transfers to public corporations %u2013 %u2013 %u2013 %u2013 %u2013 %u2013 %u2013 %u2013 %u2013Private enterprises %u2013 %u2013 %u2013 %u2013 %u2013 %u2013 %u2013 %u2013 %u2013Subsidies on products and production (pe) %u2013 %u2013 %u2013 %u2013 %u2013 %u2013 %u2013 %u2013 %u2013Other transfers to private enterprises %u2013 %u2013 %u2013 %u2013 %u2013 %u2013 %u2013 %u2013 %u2013Non-profit institutions %u2013 27 068 35 450 16 374 35 942 43 145 17 892 17 895 18 700 (58.5)Households 219 429 1 093 %u2013 1 000 1 099 900 %u2013 %u2013 (18.1)Social benefits 219 429 1 093 %u2013 1 000 1 099 900 %u2013 %u2013 (18.1)Other transfers to households %u2013 %u2013 %u2013 %u2013 %u2013 %u2013 %u2013 %u2013 %u2013Payments for capital assets 74 974 19 990 17 640 10 110 17 769 17 303 13 966 11 049 11 546 (19.3)Buildings and other fixed structures %u2013 %u2013 2 257 %u2013 %u2013 %u2013 %u2013 %u2013 %u2013Buildings %u2013 %u2013 2 257 %u2013 %u2013 %u2013 %u2013 %u2013 %u2013Other fixed structures %u2013 %u2013 %u2013 %u2013 %u2013 %u2013 %u2013 %u2013 %u2013Machinery and equipment 74 974 19 990 15 383 10 110 17 769 17 303 13 966 11 049 11 546 (19.3)Transport equipment %u2013 %u2013 %u2013 %u2013 1 140 590 8 695 %u2013 %u2013 1373.7Other machinery and equipment 74 974 19 990 15 383 10 110 16 629 16 713 5 271 11 049 11 546 (68.5)Heritage Assets %u2013 %u2013 %u2013 %u2013 %u2013 %u2013 %u2013 %u2013 %u2013Specialised military assets %u2013 %u2013 %u2013 %u2013 %u2013 %u2013 %u2013 %u2013 %u2013Biological assets %u2013 %u2013 %u2013 %u2013 %u2013 %u2013 %u2013 %u2013 %u2013Land and sub-soil assets %u2013 %u2013 %u2013 %u2013 %u2013 %u2013 %u2013 %u2013 %u2013Software and other intangible assets %u2013 %u2013 %u2013 %u2013 %u2013 %u2013 %u2013 %u2013 %u2013Payments for financial assets %u2013 %u2013 %u2013 %u2013 %u2013 %u2013 %u2013 %u2013 %u2013Total economic classification 3 116 477 3 214 612 2 884 993 3 077 003 3 077 003 3 077 003 3 110 225 3 253 178 3 400 306 1.12024/25210
