
Page 233 - Demo
P. 233
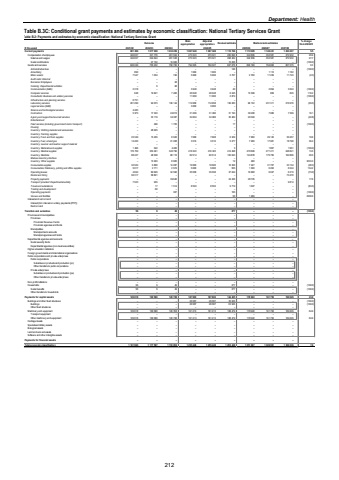
Department: HealthTable B.3C: Conditional grant payments and estimates by economic classification: National Tertiary Services Grant Table B.2: Payments and estimates by economic classification: National Tertiary Services GrantOutcome Main appropriationAdjusted appropriation Revised estimate Medium-term estimates % change from 2024/25R thousand 2021/22 2022/23 2023/24 2025/26 2026/27 2027/28Current payments 981 086 1 077 008 1 032 299 1 067 648 1 067 648 1 110 766 1 172 085 1 148 241 1 200 207 5.5Compensation of employees 340 837 321 776 281 504 273 323 273 321 283 690 342 895 353 581 372 932 20.9Salaries and wages 340 837 294 624 261 538 273 323 273 321 268 484 342 895 353 581 372 932 27.7Social contributions %u2013 27 152 19 966 %u2013 %u2013 15 206 %u2013 %u2013 %u2013 (100.0)Goods and services 640 249 755 232 750 795 794 325 794 327 827 076 829 190 794 660 827 275 0.3Administrative fees %u2013 %u2013 %u2013 %u2013 %u2013 146 %u2013 %u2013 %u2013 (100.0)Advertising 890 %u2013 %u2013 1 000 1 000 %u2013 %u2013 1 112 1 162Minor assets 7 547 1 034 746 5 990 5 990 2 707 2 700 11 239 11 743 (0.3)Audit costs: External %u2013 %u2013 %u2013 %u2013 %u2013 %u2013 %u2013 %u2013 %u2013Bursaries: Employees %u2013 %u2013 28 %u2013 %u2013 %u2013 %u2013 %u2013 %u2013Catering: Departmental activities %u2013 9 98 %u2013 %u2013 %u2013 %u2013 %u2013 %u2013Communication (G&S) 2 318 %u2013 %u2013 3 948 3 948 40 %u2013 2 894 3 024 (100.0)Computer services 648 19 841 7 460 20 048 20 048 6 245 13 500 809 845 116.2Consultants: Business and advisory services %u2013 %u2013 %u2013 11 000 11 000 2 874 %u2013 %u2013 %u2013 (100.0)Infrastructure and planning services 6 751 %u2013 %u2013 %u2013 %u2013 %u2013 %u2013 %u2013 %u2013Laboratory services 201 290 94 073 136 144 114 958 114 958 136 283 96 132 231 311 210 976 (29.5)Legal services (G&S) %u2013 %u2013 %u2013 3 000 3 000 %u2013 %u2013 %u2013 %u2013Science and technological services 4 483 %u2013 %u2013 %u2013 %u2013 %u2013 %u2013 %u2013 %u2013Contractors 5 673 17 343 24 813 31 206 31 206 31 193 36 200 7 080 7 399 16.1Agency and support/outsourced services %u2013 33 119 34 387 34 004 34 006 35 484 20 304 %u2013 %u2013 (42.8)Entertainment %u2013 %u2013 %u2013 %u2013 %u2013 %u2013 %u2013 %u2013 %u2013Fleet services (including government motor transport) %u2013 496 1 725 %u2013 %u2013 17 %u2013 %u2013 %u2013 (100.0)Housing %u2013 %u2013 %u2013 %u2013 %u2013 %u2013 %u2013 %u2013 %u2013Inventory: Clothing material and accessories %u2013 28 025 %u2013 %u2013 %u2013 %u2013 %u2013 %u2013 %u2013Inventory: Farming supplies %u2013 %u2013 %u2013 %u2013 %u2013 %u2013 %u2013 %u2013 %u2013Inventory: Food and food supplies 23 349 15 455 8 920 7 668 7 668 6 329 7 000 29 145 30 457 10.6Inventory: Fuel, oil and gas 14 405 %u2013 21 208 3 516 3 516 5 277 7 200 17 981 18 790 36.4Inventory: Learner and teacher support material %u2013 %u2013 %u2013 %u2013 %u2013 %u2013 %u2013 %u2013 %u2013Inventory: Materials and supplies 1 496 542 4 465 %u2013 %u2013 3 %u2013 1 867 1 951 (100.0)Inventory: Medical supplies 176 739 353 491 340 796 416 322 416 322 414 498 470 609 271 411 248 841 13.5Inventory: Medicine 88 437 48 538 68 110 82 514 82 514 103 643 124 878 175 795 162 806 20.5Medsas inventory interface %u2013 %u2013 %u2013 %u2013 %u2013 %u2013 %u2013 %u2013 %u2013Inventory: Other supplies %u2013 13 293 8 983 %u2013 %u2013 12 400 %u2013 %u2013 3233.3Consumable supplies 32 522 6 800 14 287 10 000 10 000 10 356 7 427 31 707 33 134 (28.3)Consumables: Stationery, printing and office supplies 5 017 2 711 2 574 5 000 5 000 555 1 300 6 262 6 544 134.2Operating leases 4 844 60 629 34 590 35 558 35 558 37 044 10 008 6 047 6 319 (73.0)Rental and hiring 56 317 58 821 %u2013 %u2013 %u2013 %u2013 %u2013 %u2013 73 470Property payments %u2013 %u2013 39 640 %u2013 %u2013 24 436 28 725 %u2013 %u2013 17.6Transport provided: Departmental activity 7 523 935 %u2013 %u2013 %u2013 %u2013 %u2013 %u2013 9 814Travel and subsistence %u2013 17 1 514 8 593 8 593 9 719 1 607 %u2013 %u2013 (83.5)Training and development %u2013 60 %u2013 %u2013 %u2013 %u2013 %u2013 %u2013 %u2013Operating payments %u2013 %u2013 307 %u2013 %u2013 165 %u2013 %u2013 %u2013 (100.0)Venues and facilities %u2013 %u2013 %u2013 %u2013 %u2013 50 1 200 %u2013 %u2013 2300.0Interest and rent on land %u2013 %u2013 %u2013 %u2013 %u2013 %u2013 %u2013 %u2013 %u2013Interest (Incl. interest on unitary payments (PPP)) %u2013 %u2013 %u2013 %u2013 %u2013 %u2013 %u2013 %u2013 %u2013Rent on land %u2013 %u2013 %u2013 %u2013 %u2013 %u2013 %u2013 %u2013 %u2013Transfers and subsidies 56 9 49 %u2013 %u2013 277 %u2013 %u2013 %u2013 (100.0)Provinces and municipalities %u2013 %u2013 %u2013 %u2013 %u2013 %u2013 %u2013 %u2013 %u2013Provinces %u2013 %u2013 %u2013 %u2013 %u2013 %u2013 %u2013 %u2013 %u2013Provincial Revenue Funds %u2013 %u2013 %u2013 %u2013 %u2013 %u2013 %u2013 %u2013 %u2013Provincial agencies and funds %u2013 %u2013 %u2013 %u2013 %u2013 %u2013 %u2013 %u2013 %u2013Municipalities %u2013 %u2013 %u2013 %u2013 %u2013 %u2013 %u2013 %u2013 %u2013Municipal bank accounts %u2013 %u2013 %u2013 %u2013 %u2013 %u2013 %u2013 %u2013 %u2013Municipal agencies and funds %u2013 %u2013 %u2013 %u2013 %u2013 %u2013 %u2013 %u2013 %u2013Departmental agencies and accounts %u2013 %u2013 %u2013 %u2013 %u2013 %u2013 %u2013 %u2013 %u2013Social security funds %u2013 %u2013 %u2013 %u2013 %u2013 %u2013 %u2013 %u2013 %u2013Departmental agencies (non-business entities) %u2013 %u2013 %u2013 %u2013 %u2013 %u2013 %u2013 %u2013 %u2013Higher education institutions %u2013 %u2013 %u2013 %u2013 %u2013 %u2013 %u2013 %u2013 %u2013Foreign governments and international organisations %u2013 %u2013 %u2013 %u2013 %u2013 %u2013 %u2013 %u2013 %u2013Public corporations and private enterprises %u2013 %u2013 %u2013 %u2013 %u2013 %u2013 %u2013 %u2013 %u2013Public corporations %u2013 %u2013 %u2013 %u2013 %u2013 %u2013 %u2013 %u2013 %u2013Subsidies on products and production (pc) %u2013 %u2013 %u2013 %u2013 %u2013 %u2013 %u2013 %u2013 %u2013Other transfers to public corporations %u2013 %u2013 %u2013 %u2013 %u2013 %u2013 %u2013 %u2013 %u2013Private enterprises %u2013 %u2013 %u2013 %u2013 %u2013 %u2013 %u2013 %u2013 %u2013Subsidies on products and production (pe) %u2013 %u2013 %u2013 %u2013 %u2013 %u2013 %u2013 %u2013 %u2013Other transfers to private enterprises %u2013 %u2013 %u2013 %u2013 %u2013 %u2013 %u2013 %u2013 %u2013Non-profit institutions %u2013 %u2013 %u2013 %u2013 %u2013 %u2013 %u2013 %u2013 %u2013Households 56 9 49 %u2013 %u2013 277 %u2013 %u2013 %u2013 (100.0)Social benefits 56 9 49 %u2013 %u2013 277 %u2013 %u2013 %u2013 (100.0)Other transfers to households %u2013 %u2013 %u2013 %u2013 %u2013 %u2013 %u2013 %u2013 %u2013Payments for capital assets 120 818 100 580 120 708 187 800 187 800 144 405 178 922 161 750 169 029 23.9Buildings and other fixed structures %u2013 %u2013 %u2013 26 587 26 587 35 926 %u2013 %u2013 %u2013 (100.0)Buildings %u2013 %u2013 %u2013 26 587 26 587 35 926 %u2013 %u2013 %u2013 (100.0)Other fixed structures %u2013 %u2013 %u2013 %u2013 %u2013 %u2013 %u2013 %u2013 %u2013Machinery and equipment 120 818 100 580 120 708 161 213 161 213 108 479 178 922 161 750 169 029 64.9Transport equipment %u2013 %u2013 %u2013 %u2013 %u2013 %u2013 %u2013 %u2013 %u2013Other machinery and equipment 120 818 100 580 120 708 161 213 161 213 108 479 178 922 161 750 169 029 64.9Heritage Assets %u2013 %u2013 %u2013 %u2013 %u2013 %u2013 %u2013 %u2013 %u2013Specialised military assets %u2013 %u2013 %u2013 %u2013 %u2013 %u2013 %u2013 %u2013 %u2013Biological assets %u2013 %u2013 %u2013 %u2013 %u2013 %u2013 %u2013 %u2013 %u2013Land and sub-soil assets %u2013 %u2013 %u2013 %u2013 %u2013 %u2013 %u2013 %u2013 %u2013Software and other intangible assets %u2013 %u2013 %u2013 %u2013 %u2013 %u2013 %u2013 %u2013 %u2013Payments for financial assets %u2013 %u2013 %u2013 %u2013 %u2013 %u2013 %u2013 %u2013 %u2013Total economic classification 1 101 960 1 177 597 1 153 056 1 255 448 1 255 448 1 255 448 1 351 007 1 309 991 1 369 236 7.62024/25212
