
Page 279 - Demo
P. 279
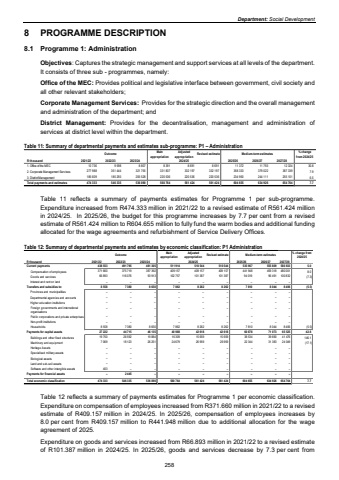
Department: Social Development8 PROGRAMME DESCRIPTION 8.1 Programme 1: Administration Objectives: Captures the strategic management and support services at all levels of the department. It consists of three sub - programmes, namely: Office of the MEC: Provides political and legislative interface between government, civil society and all other relevant stakeholders; Corporate Management Services: Provides for the strategic direction and the overall management and administration of the department; and District Management: Provides for the decentralisation, management and administration of services at district level within the department. Table 11: Summary of departmental payments and estimates sub-programme: P1 %u2013 Administration Outcome Main appropriationAdjusted appropriation Revised estimate Medium-term estimates % change from 2024/25R thousand 2021/22 2022/23 2023/24 2025/26 2026/27 2027/281. Office of the MEC 10 736 9 598 8 807 8 391 8 691 8 691 11 372 11 793 12 324 30.82. Corporate Management Services 277 988 351 444 321 755 331 837 332 197 332 197 358 333 379 022 387 339 7.93. District Management 185 609 185 293 205 528 220 536 220 536 220 536 234 950 244 111 255 101 6.5Total payments and estimates 474 333 546 335 536 090 560 764 561 424 561 424 604 655 634 926 654 764 7.72024/25Table 11 reflects a summary of payments estimates for Programme 1 per sub-programme. Expenditure increased from R474.333 million in 2021/22 to a revised estimate of R561.424 million in 2024/25. In 2025/26, the budget for this programme increases by 7.7 per cent from a revised estimate of R561.424 million to R604.655 million to fully fund the warm bodies and additional funding allocated for the wage agreements and refurbishment of Service Delivery Offices. Table 12: Summary of departmental payments and estimates by economic classification: P1 Administration Outcome Main appropriationAdjusted appropriation Revised estimate Medium-term estimates % change from 2024/25R thousand 2021/22 2022/23 2023/24 2025/26 2026/27 2027/28Current payments 491 795 438 553 481 305 511 914 510 544 510 544 535 967 555 809 580 833 5.0Compensation of employees 375 719 371 660 387 392 409 157 409 157 409 157 441 948 459 318 480 001 8.0Goods and services 66 893 116 076 93 913 102 757 101 387 101 387 94 019 100 832 96 491 (7.3)Interest and rent on land %u2013 %u2013 %u2013 %u2013 %u2013 %u2013 %u2013 %u2013 %u2013Transfers and subsidies to: 8 558 7 380 8 650 7 862 8 262 8 262 7 810 8 406 8 044 (5.5)Provinces and municipalities %u2013 %u2013 %u2013 %u2013 %u2013 %u2013 %u2013 %u2013 %u2013Departmental agencies and accounts %u2013 %u2013 %u2013 %u2013 %u2013 %u2013 %u2013 %u2013 %u2013Higher education institutions %u2013 %u2013 %u2013 %u2013 %u2013 %u2013 %u2013 %u2013 %u2013Foreign governments and international organisations %u2013 %u2013 %u2013 %u2013 %u2013 %u2013 %u2013 %u2013 %u2013Public corporations and private enterprises %u2013 %u2013 %u2013 %u2013 %u2013 %u2013 %u2013 %u2013 %u2013Non-profit institutions %u2013 %u2013 %u2013 %u2013 %u2013 %u2013 %u2013 %u2013 %u2013Households 8 558 7 380 8 650 7 862 8 262 8 262 7 810 8 406 8 044 (5.5)Payments for capital assets 27 222 44 715 46 135 40 988 42 618 42 618 60 878 65 525 71 073 42.8Buildings and other fixed structures 19 750 26 592 19 884 16 309 15 659 15 659 38 534 41 476 39 690 146.1Machinery and equipment 7 069 18 123 26 251 24 679 26 959 26 959 22 344 24 049 31 383 (17.1)Heritage Assets %u2013 %u2013 %u2013 %u2013 %u2013 %u2013 %u2013 %u2013 %u2013Specialised military assets %u2013 %u2013 %u2013 %u2013 %u2013 %u2013 %u2013 %u2013 %u2013Biological assets %u2013 %u2013 %u2013 %u2013 %u2013 %u2013 %u2013 %u2013 %u2013Land and sub-soil assets %u2013 %u2013 %u2013 %u2013 %u2013 %u2013 %u2013 %u2013 %u2013Software and other intangible assets 403 %u2013 %u2013 %u2013 %u2013 %u2013 %u2013 %u2013 %u2013Payments for financial assets %u2013 2 445 %u2013 %u2013 %u2013 %u2013 %u2013 %u2013 %u2013Total economic classification 474 333 546 335 536 090 560 764 561 424 561 424 604 655 654 764 634 926 7.72024/25Table 12 reflects a summary of payments estimates for Programme 1 per economic classification. Expenditure on compensation of employees increased from R371.660 million in 2021/22 to a revised estimate of R409.157 million in 2024/25. In 2025/26, compensation of employees increases by 8.0 per cent from R409.157 million to R441.948 million due to additional allocation for the wage agreement of 2025. Expenditure on goods and services increased from R66.893 million in 2021/22 to a revised estimate of R101.387 million in 2024/25. In 2025/26, goods and services decrease by 7.3 per cent from 258
