
Page 278 - Demo
P. 278
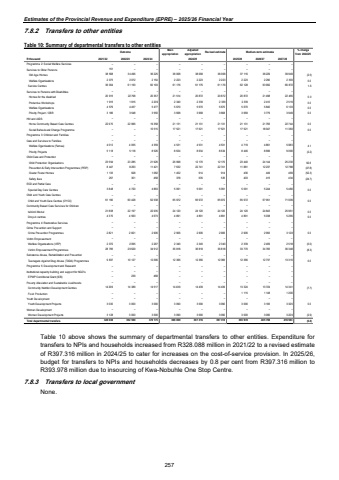
Estimates of the Provincial Revenue and Expenditure (EPRE) %u2013 2025/26 Financial Year7.8.2 Transfers to other entities Table 10: Summary of departmental transfers to other entities Outcome Main appropriationAdjusted appropriation Revised estimate Medium-term estimates % change from 2024/25R thousand 2021/22 2022/23 2023/24 2025/26 2026/27 2027/28Programme 2: Social Welfare Services %u2013 %u2013 %u2013 %u2013 %u2013 %u2013 %u2013 %u2013 %u2013 Services to Older Persons %u2013 151 %u2013 %u2013 %u2013 %u2013 %u2013 %u2013 %u2013 Old Age Homes 34 496 38 568 36 225 38 068 38 068 38 068 37 116 38 229 39 949 (2.5) Welfare Ogarnisations 2 072 2 073 2 154 2 223 2 223 2 223 2 223 2 290 2 393 0.0 Service Centres 61 150 36 004 60 193 61 176 61 176 61 176 62 128 63 992 66 872 1.6Services to Persons with Disabilities %u2013 %u2013 %u2013 %u2013 %u2013 %u2013 %u2013 %u2013 %u2013 Homes for the disabled 22 798 20 915 20 367 21 514 20 872 20 872 20 872 21 498 22 465 0.0 Protective Workshops 1 915 1 915 2 209 2 340 2 339 2 339 2 339 2 410 2 519 0.0 Welfare Ogarnisations 4 579 4 457 5 477 5 670 5 670 5 670 5 670 5 840 6 103 0.0 Priority Project / CBR 3 186 3 548 3 550 3 668 3 668 3 668 3 669 3 779 3 949 0.0HIV and AIDS %u2013 %u2013 %u2013 %u2013 %u2013 %u2013 %u2013 %u2013 %u2013 Home Community Based Care Centres 22 970 22 966 19 358 21 131 21 131 21 131 21 131 21 765 22 744 0.0 Social Behavioural Change Programme %u2013 10 515 %u2013 17 521 17 521 17 521 17 521 18 047 11 383 0.0Programme 3: Children and Families %u2013 %u2013 %u2013 %u2013 %u2013 %u2013 %u2013 %u2013 %u2013Care and Services to Families %u2013 %u2013 %u2013 %u2013 %u2013 %u2013 %u2013 %u2013 %u2013 Welfare Ogarnisations (Famsa) 4 010 4 055 4 359 4 531 4 531 4 531 4 719 4 861 5 080 4.1 Priority Projects 5 118 5 118 8 526 8 634 8 634 8 634 8 446 8 699 9 090 (2.2)Child Care and Protection %u2013 %u2013 %u2013 %u2013 %u2013 %u2013 %u2013 %u2013 %u2013 Child Protection Organisations 23 594 23 285 21 926 26 998 12 170 12 170 23 440 24 144 25 230 92.6 Prevention & Early Intervention Programmes (PEIP) 8 447 8 263 11 421 7 632 22 741 22 741 11 881 12 237 12 788 (47.8) Cluster Foster Homes 1 133 928 1 082 1 402 914 914 436 449 469 (52.3) Safety fees 257 301 458 378 535 535 403 415 434 (24.7)ECD and Partial Care %u2013 %u2013 %u2013 %u2013 %u2013 %u2013 %u2013 %u2013 %u2013 Special Day Care Centres 3 848 4 720 4 863 5 091 5 091 5 091 5 091 5 244 5 480 0.0Child and Youth Care Centres %u2013 %u2013 %u2013 %u2013 %u2013 %u2013 %u2013 %u2013 %u2013 Child and Youth Care Centres (CYCC) 61 190 60 428 62 538 65 972 65 972 65 972 65 972 67 951 71 009 0.0Community Based Care Services for Children %u2013 %u2013 %u2013 %u2013 %u2013 %u2013 %u2013 %u2013 %u2013 Isibindi Model 21 808 22 197 22 935 24 120 24 120 24 120 24 120 24 843 25 961 0.0 Drop-in centres 4 370 4 563 4 673 4 891 4 891 4 891 4 891 5 038 5 265 0.0Programme 4: Restorative Services %u2013 %u2013 %u2013 %u2013 %u2013 %u2013 %u2013 %u2013 %u2013Crime Prevention and Support %u2013 %u2013 %u2013 %u2013 %u2013 %u2013 %u2013 %u2013 %u2013 Crime Prevention Programmes 2 821 2 821 2 906 2 906 2 906 2 906 2 906 2 993 3 128 0.0Victim Empowerment %u2013 %u2013 %u2013 %u2013 %u2013 %u2013 %u2013 %u2013 %u2013 Welfare Organisations (VEP) 2 072 2 095 2 267 2 340 2 340 2 340 2 339 2 409 2 518 (0.0) Victim Empowerment Programmes 28 795 29 629 34 912 36 818 36 818 36 818 33 770 34 783 36 348 (8.3)Substance Abuse, Rehabilitation and Prevention %u2013 %u2013 %u2013 %u2013 %u2013 %u2013 %u2013 %u2013 %u2013 Teenagers Against Drug Abuse (TADA) Programmes 9 837 10 127 12 096 12 366 12 366 12 366 12 366 12 737 13 310 0.0Programme 5: Development and Research %u2013 %u2013 %u2013 %u2013 %u2013 %u2013 %u2013 %u2013 %u2013Institutional capacity building and support for NGO's %u2013 %u2013 %u2013 %u2013 %u2013 %u2013 %u2013 %u2013 %u2013 EPWP Conditional Grant (ICB) %u2013 239 468 %u2013 %u2013 %u2013 %u2013 %u2013 %u2013Poverty Alleviation and Sustainable Livelihoods %u2013 %u2013 %u2013 %u2013 %u2013 %u2013 %u2013 %u2013 %u2013 Community Nutrition Development Centres 14 299 14 389 14 517 14 439 14 439 14 439 13 324 13 724 14 341 (7.7) Food Production %u2013 %u2013 %u2013 %u2013 %u2013 %u2013 1 115 1 148 1 200Youth Development %u2013 %u2013 %u2013 %u2013 %u2013 %u2013 %u2013 %u2013 %u2013 Youth Development Projects 3 000 3 000 3 090 3 090 3 090 3 090 3 090 3 183 3 326 0.0Women Development %u2013 %u2013 %u2013 %u2013 %u2013 %u2013 %u2013 %u2013 %u2013 Women Development Projects 3 128 3 000 3 090 3 090 3 090 3 090 3 000 3 090 3 229 (2.9)Total departmental transfers 328 088 352 560 376 175 398 009 397 316 397 316 393 978 405 798 416 583 (0.8)2024/25Table 10 above shows the summary of departmental transfers to other entities. Expenditure for transfers to NPIs and households increased from R328.088 million in 2021/22 to a revised estimate of R397.316 million in 2024/25 to cater for increases on the cost-of-service provision. In 2025/26, budget for transfers to NPIs and households decreases by 0.8 per cent from R397.316 million to R393.978 million due to insourcing of Kwa-Nobuhle One Stop Centre. 7.8.3 Transfers to local government None. 257
