
Page 360 - Demo
P. 360
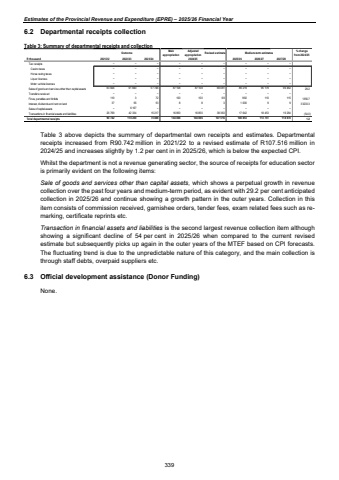
Estimates of the Provincial Revenue and Expenditure (EPRE) %u2013 2025/26 Financial Year6.2 Departmental receipts collection Table 3: Summary of departmental receipts and collection Outcome Main appropriationAdjusted appropriation Revised estimate Medium-term estimates % change from 2024/25R thousand 2021/22 2022/23 2023/24 2025/26 2026/27 2027/28Tax receipts %u2013 %u2013 %u2013 %u2013 %u2013 %u2013 %u2013 %u2013 %u2013 Casino taxes %u2013 %u2013 %u2013 %u2013 %u2013 %u2013 %u2013 %u2013 %u2013 Horse racing taxes %u2013 %u2013 %u2013 %u2013 %u2013 %u2013 %u2013 %u2013 %u2013 Liquor licences %u2013 %u2013 %u2013 %u2013 %u2013 %u2013 %u2013 %u2013 %u2013 Motor vehicle licences %u2013 %u2013 %u2013 %u2013 %u2013 %u2013 %u2013 %u2013 %u2013 Sales of goods and services other than capital assets 61 690 63 826 57 746 87 108 87 108 69 081 89 219 95 179 99 462 29.2Transfers received %u2013 %u2013 %u2013 %u2013 %u2013 %u2013 %u2013 %u2013 %u2013 Fines, penalties and forfeits 3 110 72 100 100 68 992 110 115 1356.7Interest, dividends and rent on land 37 56 53 8 8 3 1 000 9 9 33233.3Sales of capital assets %u2013 6 167 %u2013 %u2013 %u2013 %u2013 %u2013 %u2013 %u2013Transactions in financial assets and liabilities 26 769 42 334 15 217 16 850 16 850 38 363 17 642 18 453 19 284 (54.0)Total departmental receipts 90 742 110 250 73 088 104 066 104 066 107 516 108 853 113 751 118 870 1.22024/25 Table 3 above depicts the summary of departmental own receipts and estimates. Departmental receipts increased from R90.742 million in 2021/22 to a revised estimate of R107.516 million in 2024/25 and increases slightly by 1.2 per cent in in 2025/26, which is below the expected CPI. Whilst the department is not a revenue generating sector, the source of receipts for education sector is primarily evident on the following items: Sale of goods and services other than capital assets, which shows a perpetual growth in revenue collection over the past four years and medium-term period, as evident with 29.2 per cent anticipated collection in 2025/26 and continue showing a growth pattern in the outer years. Collection in this item consists of commission received, garnishee orders, tender fees, exam related fees such as remarking, certificate reprints etc. Transaction in financial assets and liabilities is the second largest revenue collection item although showing a significant decline of 54 per cent in 2025/26 when compared to the current revised estimate but subsequently picks up again in the outer years of the MTEF based on CPI forecasts. The fluctuating trend is due to the unpredictable nature of this category, and the main collection is through staff debts, overpaid suppliers etc. 6.3 Official development assistance (Donor Funding) None. 339
