
Page 364 - Demo
P. 364
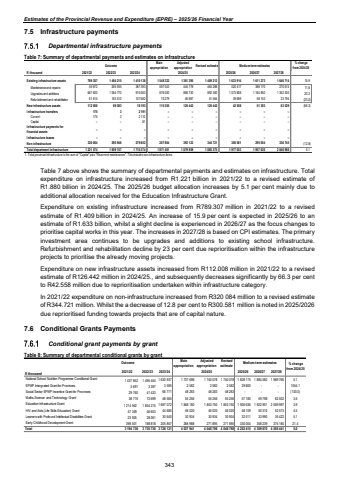
Estimates of the Provincial Revenue and Expenditure (EPRE) %u2013 2025/26 Financial Year7.5 Infrastructure payments Departmental infrastructure paymentsTable 7: Summary of departmental payments and estimates on infrastructure Outcome Main appropriationAdjusted appropriation Revised estimate Medium-term estimates % change from 2024/25R thousand 2021/22 2022/23 2023/24 2025/26 2026/27 2027/28Existing infrastructure assets 1 494 215 789 307 1 410 138 1 548 322 1 361 395 1 409 212 1 633 914 1 611 273 1 646 714 15.9Maintenance and repairs 265 935 59 872 387 393 597 043 445 778 465 288 520 417 388 170 270 615 11.8Upgrades and additions 1 064 770 667 820 915 063 876 000 868 730 892 360 1 073 808 1 164 950 1 352 305 20.3Refurbishment and rehabilitation 163 510 61 615 107 682 75 279 46 887 51 564 39 689 58 153 23 794 (23.0)New infrastructure assets 69 583 112 008 18 193 115 355 126 442 126 442 42 558 51 303 63 529 (66.3)Infrastructure transfers 175 3 2 191 %u2013 %u2013 %u2013 %u2013 %u2013 %u2013 Current 175 3 2 110 %u2013 %u2013 %u2013 %u2013 %u2013 %u2013 Capital %u2013 %u2013 81 %u2013 %u2013 %u2013 %u2013 %u2013 %u2013 Infrastructure payments for financial assets %u2013 %u2013 %u2013 %u2013 %u2013 %u2013 %u2013 %u2013 %u2013Infrastructure leases %u2013 %u2013 %u2013 %u2013 %u2013 %u2013 %u2013 %u2013 %u2013Non infrastructure 320 084 295 946 279 852 207 804 392 122 344 721 300 581 295 054 336 745 (12.8)Total department infrastructure 1 221 574 1 859 747 1 710 374 1 871 481 1 879 959 1 880 375 1 977 053 1 957 630 2 046 988 5.11. Total provincial infrastructure is the sum of \s non infrastructure items.2024/25 Table 7 above shows the summary of departmental payments and estimates on infrastructure. Total expenditure on infrastructure increased from R1.221 billion in 2021/22 to a revised estimate of R1.880 billion in 2024/25. The 2025/26 budget allocation increases by 5.1 per cent mainly due to additional allocation received for the Education Infrastructure Grant. Expenditure on existing infrastructure increased from R789.307 million in 2021/22 to a revised estimate of R1.409 billion in 2024/25. An increase of 15.9 per cent is expected in 2025/26 to an estimate of R1.633 billion, whilst a slight decline is experienced in 2026/27 as the focus changes to prioritise capital works in this year. The increases in 2027/28 is based on CPI estimates. The primary investment area continues to be upgrades and additions to existing school infrastructure. Refurbishment and rehabilitation decline by 23 per cent due reprioritisation within the infrastructure projects to prioritise the already moving projects. Expenditure on new infrastructure assets increased from R112.008 million in 2021/22 to a revised estimate of R126.442 million in 2024/25., and subsequently decreases significantly by 66.3 per cent to R42.558 million due to reprioritisation undertaken within infrastructure category. In 2021/22 expenditure on non-infrastructure increased from R320 084 million to a revised estimate of R344.721 million. Whilst the a decrease of 12.8 per cent to R300.581 million is noted in 2025/2026 due reprioritised funding towards projects that are of capital nature. 7.6 Conditional Grants Payments Conditional grant payments by grant Table 8: Summary of departmental conditional grants by grant Outcome Mainappropriation Adjusted appropriation Revised estimate 2021/22 2022/23 2023/24 2024/25 2025/26 2026/27 2027/281 437 852 1 495 454 1 630 937 1 737 698 1 740 078 1 740 078 1 828 175 1 884 582 1 969 766 5.1 3 691 3 397 3 595 2 582 2 582 2 582 29 800 - - 1054.1 29 760 41 433 66 771 48 283 48 283 48 283 - - - (100.0) 38 716 72 699 48 565 55 256 55 256 55 256 57 180 59 798 62 502 3.5 1 214 942 1 854 215 1 697 072 1 848 180 1 853 750 1 853 750 1 926 636 1 922 951 2 009 997 3.9 47 349 46 653 44 685 46 020 46 020 46 020 48 109 50 310 52 573 4.5 23 925 28 061 30 640 30 934 30 934 30 934 32 511 33 990 35 422 5.1 398 501 188 818 205 857 268 988 271 895 271 895 330 004 358 239 375 180 21.4 3 194 736 3 730 730 3 728 121 4 037 941 4 048 798 4 048 798 4 252 415 4 309 870 4 505 441 5.0 HIV and Aids (Life Skills Education) Grant Leaners with Profound Intellectual Disabilities Grant Early Childhood Development Grant R thousand % change from 2024/25 National School Nutrition Programme Conditional Grant Medium-term estimates EPWP Intergrated Grant for Provinces Social Sector EPWP Incentive Grant for Provinces Maths,Science and Technology Grant Education Infrastructure Grant Total 343
