
Page 362 - Demo
P. 362
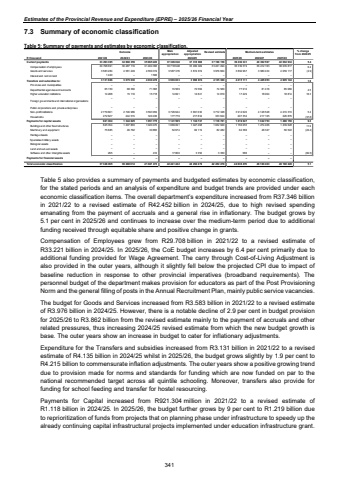
Estimates of the Provincial Revenue and Expenditure (EPRE) %u2013 2025/26 Financial Year7.3 Summary of economic classification Table 5: Summary of payments and estimates by economic classification. Outcome Main appropriationAdjusted appropriation Revised estimate Medium-term estimates % change from 2024/25R thousand 2021/22 2022/23 2023/24 2025/26 2026/27 2027/28Current payments 33 293 395 34 868 359 35 965 220 37 306 024 37 318 668 37 198 158 39 202 341 40 392 597 42 094 934 5.4Compensation of employees 29 708 691 30 287 110 31 404 395 33 718 648 33 499 049 33 221 494 35 339 374 36 412 163 38 035 817 6.4Goods and services 3 583 284 4 581 249 4 559 319 3 587 376 3 819 619 3 976 664 3 862 967 3 980 434 4 059 117 (2.9)Interest and rent on land 1 420 %u2013 1 506 %u2013 %u2013 %u2013 %u2013 %u2013 %u2013Transfers and subsidies to: 3 131 666 3 075 030 4 030 478 3 993 833 3 998 874 4 135 360 4 215 111 4 445 053 4 605 144 1.9Provinces and municipalities %u2013 %u2013 %u2013 %u2013 %u2013 %u2013 %u2013 %u2013 %u2013Departmental agencies and accounts 65 150 68 360 71 365 74 569 74 569 74 569 77 910 81 416 85 080 4.5Higher education institutions 14 288 15 110 15 718 14 841 14 841 14 819 17 229 18 004 18 814 16.3Foreign governments and international organisations %u2013 %u2013 %u2013 %u2013 %u2013 %u2013 %u2013 %u2013 %u2013Public corporations and private enterprises %u2013 %u2013 %u2013 %u2013 %u2013 %u2013 %u2013 %u2013 %u2013Non-profit institutions 2 779 601 2 746 986 3 593 959 3 726 644 3 691 630 3 712 348 3 912 620 4 128 528 4 274 374 5.4Households 272 627 244 574 349 436 177 779 217 834 333 624 207 352 217 105 226 876 (37.8)Payments for capital assets 921 304 1 344 625 1 051 775 1 141 565 1 134 737 1 118 761 1 219 027 1 322 753 1 490 150 9.0Buildings and other fixed structures 845 354 1 297 863 1 020 470 1 069 091 1 047 268 1 032 929 1 156 055 1 274 406 1 439 628 11.9Machinery and equipment 75 685 46 762 30 895 54 674 84 119 82 482 62 386 48 347 50 522 (24.4)Heritage Assets %u2013 %u2013 %u2013 %u2013 %u2013 %u2013 %u2013 %u2013 %u2013Specialised military assets %u2013 %u2013 %u2013 %u2013 %u2013 %u2013 %u2013 %u2013 %u2013Biological assets %u2013 %u2013 %u2013 %u2013 %u2013 %u2013 %u2013 %u2013 %u2013Land and sub-soil assets %u2013 %u2013 %u2013 %u2013 %u2013 %u2013 %u2013 %u2013 %u2013Software and other intangible assets 265 %u2013 410 17 800 3 350 3 350 586 %u2013 %u2013 (82.5)Payments for financial assets %u2013 %u2013 %u2013 %u2013 %u2013 %u2013 %u2013 %u2013 %u2013Total economic classification 37 346 365 39 288 014 41 047 473 42 441 422 42 452 279 42 452 279 44 636 479 46 160 403 48 190 228 5.12024/25 Table 5 also provides a summary of payments and budgeted estimates by economic classification, for the stated periods and an analysis of expenditure and budget trends are provided under each economic classification items. The overall department%u2019s expenditure increased from R37.346 billion in 2021/22 to a revised estimate of R42.452 billion in 2024/25, due to high revised spending emanating from the payment of accruals and a general rise in inflationary. The budget grows by 5.1 per cent in 2025/26 and continues to increase over the medium-term period due to additional funding received through equitable share and positive change in grants. Compensation of Employees grew from R29.708 billion in 2021/22 to a revised estimate of R33.221 billion in 2024/25. In 2025/26, the CoE budget increases by 6.4 per cent primarily due to additional funding provided for Wage Agreement. The carry through Cost-of-Living Adjustment is also provided in the outer years, although it slightly fell below the projected CPI due to impact of baseline reduction in response to other provincial imperatives (broadband requirements). The personnel budget of the department makes provision for educators as part of the Post Provisioning Norm and the general filling of posts in the Annual Recruitment Plan, mainly public service vacancies. The budget for Goods and Services increased from R3.583 billion in 2021/22 to a revised estimate of R3.976 billion in 2024/25. However, there is a notable decline of 2.9 per cent in budget provision for 2025/26 to R3.862 billion from the revised estimate mainly to the payment of accruals and other related pressures, thus increasing 2024/25 revised estimate from which the new budget growth is base. The outer years show an increase in budget to cater for inflationary adjustments. Expenditure for the Transfers and subsidies increased from R3.131 billion in 2021/22 to a revised estimate of R4.135 billion in 2024/25 whilst in 2025/26, the budget grows slightly by 1.9 per cent to R4.215 billion to commensurate inflation adjustments. The outer years show a positive growing trend due to provision made for norms and standards for funding which are now funded on par to the national recommended target across all quintile schooling. Moreover, transfers also provide for funding for school feeding and transfer for hostel resourcing. Payments for Capital increased from R921.304 million in 2021/22 to a revised estimate of R1.118 billion in 2024/25. In 2025/26, the budget further grows by 9 per cent to R1.219 billion due to reprioritization of funds from projects that on planning phase under infrastructure to speedy up the already continuing capital infrastructural projects implemented under education infrastructure grant. 341
