
Page 391 - Demo
P. 391
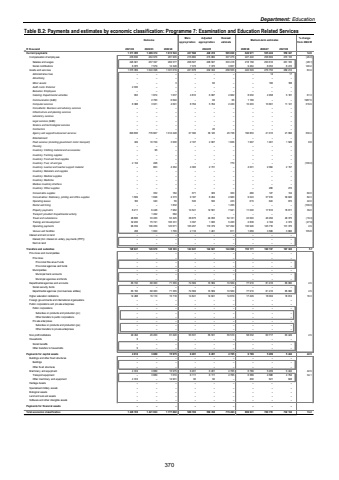
Department: EducationTable B.2: Payments and estimates by economic classification: Programme 7: Examination and Education Related Services Outcome Main appropriationAdjusted appropriationRevised estimate Medium-term estimates % change from 2024/25R thousand 2021/22 2022/23 2023/24 2025/26 2026/27 2027/28Current payments 1 311 655 1 289 374 1 613 524 437 560 448 216 565 830 649 971 535 424 559 347 14.9Compensation of employ ees 235 696 264 976 281 905 215 882 215 882 307 275 227 422 258 669 270 135 (26.0)Salaries and w ages 226 821 257 397 269 577 208 507 208 507 303 418 218 158 250 616 261 720 (28.1)Social contributions 8 875 7 579 12 328 7 375 7 375 3 857 9 264 8 053 8 415 140.2Goods and serv ices 1 075 959 1 024 398 1 331 619 221 678 232 334 258 555 422 549 276 755 289 212 63.4Administrative fees %u2013 %u2013 %u2013 %u2013 %u2013 %u2013 %u2013 14 17 Advertising %u2013 %u2013 %u2013 %u2013 %u2013 %u2013 %u2013 %u2013 %u2013 Minor assets %u2013 %u2013 3 %u2013 60 %u2013 %u2013 180 188 Audit costs: External %u2013 2 300 %u2013 %u2013 %u2013 %u2013 %u2013 %u2013 %u2013Bursaries: Employees %u2013 %u2013 %u2013 %u2013 %u2013 %u2013 %u2013 %u2013 %u2013Catering: Departmental activities 653 1 874 1 637 4 810 6 087 4 962 8 002 4 958 5 181 61.3Communication (G&S) 2 760 %u2013 6 694 %u2013 60 56 1 169 %u2013 1987.5 %u2013Computer services 8 988 3 931 4 691 8 764 5 764 2 430 10 203 10 661 11 141 319.9Consultants: Business and advisory services %u2013 %u2013 %u2013 %u2013 %u2013 %u2013 %u2013 %u2013 %u2013Infrastructure and planning services %u2013 %u2013 %u2013 %u2013 %u2013 %u2013 %u2013 %u2013 %u2013Laboratory services %u2013 %u2013 %u2013 %u2013 %u2013 %u2013 %u2013 %u2013 %u2013Legal services (G&S) %u2013 %u2013 %u2013 %u2013 %u2013 %u2013 %u2013 %u2013 %u2013Science and technological services %u2013 %u2013 %u2013 %u2013 %u2013 %u2013 %u2013 %u2013 %u2013Contractors %u2013 %u2013 %u2013 %u2013 20 %u2013 %u2013 %u2013 %u2013Agency and support/outsourced services 893 895 776 867 1 012 248 27 390 36 120 45 738 196 853 21 010 21 956 330.4Entertainment %u2013 %u2013 %u2013 %u2013 %u2013 %u2013 %u2013 %u2013 %u2013Fleet services (including government motor transport) 349 10 729 3 000 2 107 2 907 1 836 1 997 1 461 1 526 8.8Housing %u2013 %u2013 %u2013 %u2013 %u2013 %u2013 %u2013 %u2013 %u2013Inventory: Clothing material and accessories %u2013 96 %u2013 %u2013 %u2013 %u2013 %u2013 %u2013 %u2013Inventory: Farming supplies %u2013 %u2013 %u2013 %u2013 %u2013 %u2013 %u2013 %u2013 %u2013Inventory: Food and food supplies %u2013 %u2013 %u2013 %u2013 %u2013 %u2013 %u2013 %u2013 %u2013Inventory: Fuel, oil and gas 2 134 498 %u2013 %u2013 %u2013 770 %u2013 %u2013 (100.0) %u2013Inventory: Learner and teacher support material %u2013 863 4 364 4 383 2 731 4 001 %u2013 2 064 2 157Inventory: Materials and supplies %u2013 %u2013 %u2013 %u2013 %u2013 %u2013 %u2013 %u2013 %u2013Inventory: Medical supplies %u2013 %u2013 %u2013 %u2013 %u2013 %u2013 %u2013 %u2013 %u2013Inventory: Medicine %u2013 %u2013 %u2013 %u2013 %u2013 %u2013 %u2013 %u2013 %u2013Medsas inventory interface %u2013 %u2013 %u2013 %u2013 %u2013 %u2013 %u2013 %u2013 %u2013Inventory: Other supplies %u2013 %u2013 %u2013 %u2013 %u2013 %u2013 %u2013 206 215Consumable supplies %u2013 352 184 571 305 300 480 127 134 60.0Consumables: Stationery, printing and office supplies 1 569 1 698 4 373 9 187 8 264 4 960 9 043 37 919 39 626 82.3Operating leases 183 340 55 530 530 433 615 643 672 42.0Rental and hiring %u2013 1 832 %u2013 %u2013 1 455 %u2013 %u2013 %u2013 (100.0) %u2013Property payments 8 211 6 448 7 962 14 541 12 591 7 941 11 040 17 810 18 611 39.0Transport provided: Departmental activity 1 492 %u2013 384 %u2013 %u2013 %u2013 %u2013 %u2013 %u2013Travel and subsistence 28 880 33 450 53 425 38 675 44 055 54 121 43 693 46 292 48 375 (19.3)Training and development 32 200 75 741 105 331 3 397 1 000 5 450 2 838 4 184 4 372 (47.9)Operating payments 96 359 106 259 123 671 105 207 110 379 127 292 130 946 125 718 131 375 2.9Venues and facilities 238 1 000 1 765 2 116 1 461 811 1 669 3 508 3 666 105.8Interest and rent on land %u2013 %u2013 %u2013 %u2013 %u2013 %u2013 %u2013 %u2013 %u2013Interest (Incl. interest on unitary pay ments (PPP)) %u2013 %u2013 %u2013 %u2013 %u2013 %u2013 %u2013 %u2013 %u2013Rent on land %u2013 %u2013 %u2013 %u2013 %u2013 %u2013 %u2013 %u2013 %u2013Transfers and subsidies 128 941 128 670 148 303 144 941 144 941 144 898 153 171 160 137 167 343 5.7 Prov inces and municipalities %u2013 %u2013 %u2013 %u2013 %u2013 %u2013 %u2013 %u2013 %u2013Prov inces %u2013 %u2013 %u2013 %u2013 %u2013 %u2013 %u2013 %u2013 %u2013Prov incial Rev enue Funds %u2013 %u2013 %u2013 %u2013 %u2013 %u2013 %u2013 %u2013 %u2013Prov incial agencies and funds %u2013 %u2013 %u2013 %u2013 %u2013 %u2013 %u2013 %u2013 %u2013Municipalities %u2013 %u2013 %u2013 %u2013 %u2013 %u2013 %u2013 %u2013 %u2013Municipal bank accounts %u2013 %u2013 %u2013 %u2013 %u2013 %u2013 %u2013 %u2013 %u2013Municipal agencies and funds %u2013 %u2013 %u2013 %u2013 %u2013 %u2013 %u2013 %u2013 %u2013Departmental agencies and accounts 65 150 68 360 71 365 74 569 74 569 74 569 77 910 81 416 85 080 4.5Social security funds %u2013 %u2013 %u2013 %u2013 %u2013 %u2013 %u2013 %u2013 %u2013Departmental agencies (non-business entities) 65 150 68 360 71 365 74 569 74 569 74 569 77 910 81 416 85 080 4.5Higher education institutions 14 288 15 110 15 718 14 841 14 841 14 819 17 229 18 004 18 814 16.3Foreign gov ernments and international organisations %u2013 %u2013 %u2013 %u2013 %u2013 %u2013 %u2013 %u2013 %u2013Public corporations and priv ate enterprises %u2013 %u2013 %u2013 %u2013 %u2013 %u2013 %u2013 %u2013 %u2013Public corporations %u2013 %u2013 %u2013 %u2013 %u2013 %u2013 %u2013 %u2013 %u2013Subsidies on products and production (pc) %u2013 %u2013 %u2013 %u2013 %u2013 %u2013 %u2013 %u2013 %u2013Other transfers to public corporations %u2013 %u2013 %u2013 %u2013 %u2013 %u2013 %u2013 %u2013 %u2013Priv ate enterprises %u2013 %u2013 %u2013 %u2013 %u2013 %u2013 %u2013 %u2013 %u2013Subsidies on products and production (pe) %u2013 %u2013 %u2013 %u2013 %u2013 %u2013 %u2013 %u2013 %u2013Other transfers to priv ate enterprises %u2013 %u2013 %u2013 %u2013 %u2013 %u2013 %u2013 %u2013 %u2013Non-profit institutions 49 494 45 200 61 220 55 531 55 531 55 510 58 032 60 717 63 449 4.5Households 9 %u2013 %u2013 %u2013 %u2013 %u2013 %u2013 %u2013 %u2013Social benefits %u2013 %u2013 %u2013 %u2013 %u2013 %u2013 %u2013 %u2013 %u2013Other transfers to households 9 %u2013 %u2013 %u2013 %u2013 %u2013 %u2013 %u2013 %u2013Payments for capital assets 4 914 3 889 15 975 6 201 6 201 4 765 6 789 5 209 5 442 42.5Buildings and other fix ed structures %u2013 %u2013 %u2013 %u2013 %u2013 %u2013 %u2013 %u2013 %u2013Buildings %u2013 %u2013 %u2013 %u2013 %u2013 %u2013 %u2013 %u2013 %u2013Other fix ed structures %u2013 %u2013 %u2013 %u2013 %u2013 %u2013 %u2013 %u2013 %u2013Machinery and equipment 4 914 3 889 15 975 6 201 6 201 4 765 6 789 5 209 5 442 42.5Transport equipment 3 889 %u2013 1 074 6 111 6 111 4 765 6 389 4 588 4 794 34.1Other machinery and equipment 4 914 14 901 %u2013 90 90 %u2013 400 621 648Heritage Assets %u2013 %u2013 %u2013 %u2013 %u2013 %u2013 %u2013 %u2013 %u2013Specialised military assets %u2013 %u2013 %u2013 %u2013 %u2013 %u2013 %u2013 %u2013 %u2013Biological assets %u2013 %u2013 %u2013 %u2013 %u2013 %u2013 %u2013 %u2013 %u2013Land and sub-soil assets %u2013 %u2013 %u2013 %u2013 %u2013 %u2013 %u2013 %u2013 %u2013Softw are and other intangible assets %u2013 %u2013 %u2013 %u2013 %u2013 %u2013 %u2013 %u2013 %u2013Payments for financial assets %u2013 %u2013 %u2013 %u2013 %u2013 %u2013 %u2013 %u2013 %u2013Total economic classification 1 445 510 1 421 933 1 777 802 588 702 599 358 715 493 809 931 700 770 732 132 13.22024/25370
