
Page 386 - Demo
P. 386
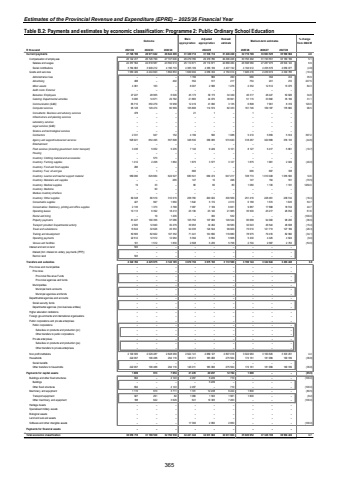
Estimates of the Provincial Revenue and Expenditure (EPRE) %u2013 2025/26 Financial YearTable B.2: Payments and estimates by economic classification: Programme 2: Public Ordinary School Education Outcome Main appropriationAdjusted appropriationRevised estimate Medium-term estimates % change from 2024/25R thousand 2021/22 2022/23 2023/24 2025/26 2026/27 2027/28Current payments 27 726 199 28 971 642 29 642 499 31 329 712 31 536 114 31 446 240 32 719 708 33 983 525 35 500 984 4.0Compensation of employ ees 26 142 217 26 726 799 27 747 646 29 479 780 29 479 780 29 296 226 30 793 492 31 743 551 33 160 199 5.1Salaries and w ages 22 357 554 22 818 587 23 550 913 25 114 671 25 114 671 24 888 484 26 598 580 27 287 975 28 504 122 6.9Social contributions 3 784 663 3 908 212 4 196 733 4 365 109 4 365 109 4 407 742 4 194 912 4 455 576 4 656 077 (4.8)Goods and serv ices 1 583 449 2 244 843 1 894 853 1 849 932 2 056 334 2 150 014 1 926 216 2 239 974 2 340 785 (10.4)Administrative fees %u2013 %u2013 %u2013 1 156 966 490 666 394 412 35.9Advertising 488 %u2013 492 552 517 217 754 201 210 247.5Minor assets 4 061 163 8 007 %u2013 2 586 1 276 2 352 12 512 13 075 84.3Audit costs: External %u2013 %u2013 %u2013 %u2013 %u2013 %u2013 %u2013 %u2013 %u2013Bursaries: Employees 27 227 28 955 6 646 45 173 39 173 34 349 46 317 48 447 50 626 34.8Catering: Departmental activities 5 085 14 671 29 782 21 865 44 070 38 991 51 115 33 682 35 199 31.1Communication (G&S) 65 710 350 279 16 958 12 419 41 090 3 135 6 898 7 961 8 319 120.0Computer services 95 128 129 474 80 569 105 806 114 574 82 333 161 746 169 187 176 800 96.5Consultants: Business and advisory services 478 %u2013 %u2013 21 1 %u2013 1 %u2013 %u2013Infrastructure and planning services %u2013 %u2013 %u2013 %u2013 %u2013 %u2013 %u2013 %u2013 %u2013Laboratory services %u2013 %u2013 %u2013 %u2013 %u2013 %u2013 %u2013 %u2013 %u2013Legal services (G&S) %u2013 %u2013 %u2013 %u2013 %u2013 %u2013 %u2013 %u2013 %u2013Science and technological services %u2013 %u2013 %u2013 %u2013 %u2013 %u2013 %u2013 %u2013 %u2013Contractors 2 331 947 152 4 199 590 1 088 5 410 5 659 5 914 397.2Agency and support/outsourced services 526 921 654 495 557 698 348 530 366 085 574 640 318 287 320 689 335 133 (44.6)Entertainment %u2013 %u2013 %u2013 %u2013 %u2013 %u2013 %u2013 %u2013 %u2013Fleet services (including government motor transport) 3 436 5 052 5 235 7 140 9 249 9 101 8 127 5 417 5 661 (10.7)Housing %u2013 %u2013 %u2013 %u2013 %u2013 %u2013 %u2013 %u2013 %u2013Inventory: Clothing material and accessories %u2013 573 %u2013 %u2013 %u2013 %u2013 %u2013 %u2013 %u2013Inventory: Farming supplies 1 412 2 458 1 884 1 875 3 577 3 127 1 875 1 961 2 049 (40.0)Inventory: Food and food supplies 296 %u2013 %u2013 %u2013 %u2013 %u2013 %u2013 %u2013 %u2013Inventory: Fuel, oil and gas %u2013 1 %u2013 666 %u2013 %u2013 666 697 728Inventory: Learner and teacher support material 589 080 629 684 624 527 680 541 684 474 647 217 728 774 1 010 048 1 055 500 12.6Inventory: Materials and supplies %u2013 %u2013 265 147 10 498 147 154 161 (70.5)Inventory: Medical supplies 19 33 %u2013 80 80 80 1 080 1 130 1 181 1250.0Inventory: Medicine %u2013 90 %u2013 %u2013 %u2013 %u2013 %u2013 %u2013 %u2013Medsas inventory interface %u2013 %u2013 %u2013 %u2013 %u2013 %u2013 %u2013 %u2013 %u2013Inventory: Other supplies 69 348 86 519 310 915 258 783 299 022 300 569 251 416 228 461 238 742 (16.4)Consumable supplies 427 997 1 660 1 642 5 172 4 013 6 168 1 574 1 645 53.7Consumables: Stationery, printing and office supplies 2 135 1 373 3 768 7 067 7 109 6 831 9 887 17 898 18 704 44.7Operating leases 19 113 6 392 18 213 25 139 25 140 21 965 35 500 25 217 26 352 61.6Rental and hiring %u2013 19 1 205 %u2013 300 532 %u2013 %u2013 (100.0) %u2013Property payments 81 427 190 356 37 086 105 793 107 066 149 544 95 668 94 000 98 230 (36.0)Transport provided: Departmental activity 2 505 12 840 30 279 39 953 34 462 38 583 32 643 46 544 48 638 (15.4)Travel and subsistence 13 644 32 626 45 353 94 035 124 544 99 829 73 610 121 713 127 189 (26.3)Training and development 50 565 82 822 107 352 71 441 134 690 119 880 78 975 79 416 82 990 (34.1)Operating payments 22 512 12 512 12 984 5 394 6 552 5 968 5 430 4 425 4 624 (9.0)Venues and facilities 101 1 512 1 830 2 508 5 235 5 758 2 704 2 587 2 703 (53.0)Interest and rent on land 533 %u2013 %u2013 %u2013 %u2013 %u2013 %u2013 %u2013 %u2013Interest (Incl. interest on unitary pay ments (PPP)) %u2013 %u2013 %u2013 %u2013 %u2013 %u2013 %u2013 %u2013 %u2013Rent on land 533 %u2013 %u2013 %u2013 %u2013 %u2013 %u2013 %u2013 %u2013Transfers and subsidies 2 322 702 2 225 975 3 142 185 3 070 152 3 075 193 3 172 580 3 199 144 3 342 644 3 493 440 0.8 Prov inces and municipalities %u2013 %u2013 %u2013 %u2013 %u2013 %u2013 %u2013 %u2013 %u2013Prov inces %u2013 %u2013 %u2013 %u2013 %u2013 %u2013 %u2013 %u2013 %u2013Prov incial Rev enue Funds %u2013 %u2013 %u2013 %u2013 %u2013 %u2013 %u2013 %u2013 %u2013Prov incial agencies and funds %u2013 %u2013 %u2013 %u2013 %u2013 %u2013 %u2013 %u2013 %u2013Municipalities %u2013 %u2013 %u2013 %u2013 %u2013 %u2013 %u2013 %u2013 %u2013Municipal bank accounts %u2013 %u2013 %u2013 %u2013 %u2013 %u2013 %u2013 %u2013 %u2013Municipal agencies and funds %u2013 %u2013 %u2013 %u2013 %u2013 %u2013 %u2013 %u2013 %u2013Departmental agencies and accounts %u2013 %u2013 %u2013 %u2013 %u2013 %u2013 %u2013 %u2013 %u2013Social security funds %u2013 %u2013 %u2013 %u2013 %u2013 %u2013 %u2013 %u2013 %u2013Departmental agencies (non-business entities) %u2013 %u2013 %u2013 %u2013 %u2013 %u2013 %u2013 %u2013 %u2013Higher education institutions %u2013 %u2013 %u2013 %u2013 %u2013 %u2013 %u2013 %u2013 %u2013Foreign gov ernments and international organisations %u2013 %u2013 %u2013 %u2013 %u2013 %u2013 %u2013 %u2013 %u2013Public corporations and priv ate enterprises %u2013 %u2013 %u2013 %u2013 %u2013 %u2013 %u2013 %u2013 %u2013Public corporations %u2013 %u2013 %u2013 %u2013 %u2013 %u2013 %u2013 %u2013 %u2013Subsidies on products and production (pc) %u2013 %u2013 %u2013 %u2013 %u2013 %u2013 %u2013 %u2013 %u2013Other transfers to public corporations %u2013 %u2013 %u2013 %u2013 %u2013 %u2013 %u2013 %u2013 %u2013Priv ate enterprises %u2013 %u2013 %u2013 %u2013 %u2013 %u2013 %u2013 %u2013 %u2013Subsidies on products and production (pe) %u2013 %u2013 %u2013 %u2013 %u2013 %u2013 %u2013 %u2013 %u2013Other transfers to priv ate enterprises %u2013 %u2013 %u2013 %u2013 %u2013 %u2013 %u2013 %u2013 %u2013Non-profit institutions 2 100 635 2 029 487 2 848 069 2 924 141 2 889 127 2 897 016 3 024 983 3 160 645 3 303 251 4.4Households 222 067 196 488 294 116 146 011 186 066 275 564 174 161 181 999 190 189 (36.8)Social benefits %u2013 %u2013 %u2013 %u2013 %u2013 %u2013 %u2013 %u2013 %u2013Other transfers to households 222 067 196 488 294 116 146 011 186 066 275 564 174 161 181 999 190 189 (36.8)Payments for capital assets 1 809 913 7 854 21 478 20 297 12 784 1 800 %u2013 %u2013 (85.9)Buildings and other fix ed structures 694 4 143 %u2013 2 457 5 209 710 %u2013 %u2013 (100.0) %u2013Buildings %u2013 %u2013 %u2013 5 209 %u2013 %u2013 %u2013 %u2013 %u2013Other fix ed structures 694 4 143 %u2013 2 457 %u2013 710 %u2013 %u2013 (100.0) %u2013Machinery and equipment 1 115 913 3 711 1 721 12 238 9 224 1 800 %u2013 %u2013 (80.5)Transport equipment 927 291 82 1 080 1 933 1 961 1 800 %u2013 %u2013 (8.2)Other machinery and equipment 188 622 3 629 641 10 305 7 263 %u2013 %u2013 (100.0) %u2013Heritage Assets %u2013 %u2013 %u2013 %u2013 %u2013 %u2013 %u2013 %u2013 %u2013Specialised military assets %u2013 %u2013 %u2013 %u2013 %u2013 %u2013 %u2013 %u2013 %u2013Biological assets %u2013 %u2013 %u2013 %u2013 %u2013 %u2013 %u2013 %u2013 %u2013Land and sub-soil assets %u2013 %u2013 %u2013 %u2013 %u2013 %u2013 %u2013 %u2013 %u2013Softw are and other intangible assets %u2013 %u2013 17 300 %u2013 2 850 2 850 %u2013 %u2013 (100.0) %u2013Payments for financial assets %u2013 %u2013 %u2013 %u2013 %u2013 %u2013 %u2013 %u2013 %u2013Total economic classification 30 050 710 31 198 530 32 792 538 34 421 342 34 631 604 34 631 604 35 920 652 37 326 169 38 994 424 3.72024/25365
