
Page 390 - Demo
P. 390
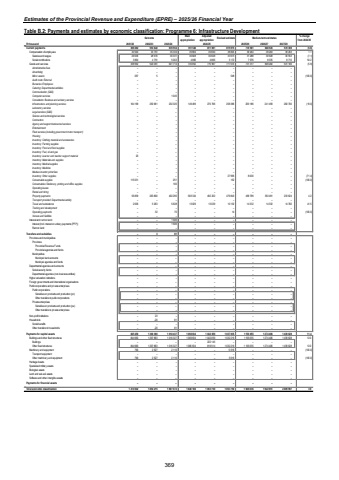
Estimates of the Provincial Revenue and Expenditure (EPRE) %u2013 2025/26 Financial YearTable B.2: Payments and estimates by economic classification: Programme 6: Infrastructure Development Outcome Main appropriationAdjusted appropriation Revised estimate Medium-term estimates % change from 2024/25R thousand 2021/22 2022/23 2023/24 2025/26 2026/27 2027/28Current payments 553 822 369 492 678 554 781 546 811 691 815 915 770 581 648 545 570 369 (5.6)Compensation of employees 30 500 33 761 35 334 35 694 35 694 38 845 39 264 39 263 39 263 1.1Salaries and wages 26 636 28 970 30 331 30 828 30 828 33 673 31 288 30 928 30 553 (7.1)Social contributions 3 864 4 791 5 003 4 866 4 866 5 172 7 976 8 335 8 710 54.2Goods and services 338 992 520 061 641 714 745 852 775 997 777 070 731 317 609 282 531 106 (5.9)Administrative fees %u2013 %u2013 %u2013 %u2013 %u2013 %u2013 %u2013 %u2013 %u2013 Advertising %u2013 %u2013 %u2013 %u2013 %u2013 %u2013 %u2013 %u2013 %u2013 Minor assets 5 267 %u2013 %u2013 %u2013 548 %u2013 %u2013 %u2013 (100.0)Audit costs: External %u2013 %u2013 %u2013 %u2013 %u2013 %u2013 %u2013 %u2013 %u2013Bursaries: Employees %u2013 %u2013 %u2013 %u2013 %u2013 %u2013 %u2013 %u2013 %u2013Catering: Departmental activities %u2013 %u2013 %u2013 %u2013 %u2013 %u2013 %u2013 %u2013 %u2013Communication (G&S) %u2013 %u2013 %u2013 %u2013 %u2013 %u2013 %u2013 %u2013 %u2013Computer services %u2013 %u2013 1 045 %u2013 %u2013 %u2013 %u2013 %u2013 %u2013Consultants: Business and advisory services %u2013 %u2013 %u2013 %u2013 %u2013 %u2013 %u2013 %u2013 %u2013Infrastructure and planning services 164 199 250 961 232 325 149 499 270 766 258 386 209 186 241 459 282 700 (19.0)Laboratory services %u2013 %u2013 %u2013 %u2013 %u2013 %u2013 %u2013 %u2013 %u2013Legal services (G&S) %u2013 %u2013 %u2013 %u2013 %u2013 %u2013 %u2013 %u2013 %u2013Science and technological services %u2013 %u2013 %u2013 %u2013 %u2013 %u2013 %u2013 %u2013 %u2013Contractors %u2013 %u2013 %u2013 %u2013 %u2013 %u2013 %u2013 %u2013 %u2013Agency and support/outsourced services %u2013 %u2013 %u2013 %u2013 %u2013 %u2013 %u2013 %u2013 %u2013Entertainment %u2013 %u2013 %u2013 %u2013 %u2013 %u2013 %u2013 %u2013 %u2013Fleet services (including government motor transport) %u2013 %u2013 %u2013 %u2013 %u2013 %u2013 %u2013 %u2013 %u2013Housing %u2013 %u2013 %u2013 %u2013 %u2013 %u2013 %u2013 %u2013 %u2013Inventory: Clothing material and accessories %u2013 %u2013 %u2013 %u2013 %u2013 %u2013 %u2013 %u2013 %u2013Inventory: Farming supplies %u2013 %u2013 %u2013 %u2013 %u2013 %u2013 %u2013 %u2013 %u2013Inventory: Food and food supplies %u2013 %u2013 %u2013 %u2013 %u2013 %u2013 %u2013 %u2013 %u2013Inventory: Fuel, oil and gas %u2013 %u2013 %u2013 %u2013 %u2013 %u2013 %u2013 %u2013 %u2013Inventory: Learner and teacher support material 20 %u2013 %u2013 %u2013 %u2013 %u2013 %u2013 %u2013 %u2013Inventory: Materials and supplies %u2013 %u2013 %u2013 %u2013 %u2013 %u2013 %u2013 %u2013 %u2013Inventory: Medical supplies %u2013 %u2013 %u2013 %u2013 %u2013 %u2013 %u2013 %u2013 %u2013Inventory: Medicine %u2013 %u2013 %u2013 %u2013 %u2013 %u2013 %u2013 %u2013 %u2013Medsas inventory interface %u2013 %u2013 %u2013 %u2013 %u2013 %u2013 %u2013 %u2013 %u2013Inventory: Other supplies %u2013 %u2013 %u2013 %u2013 %u2013 27 995 8 000 %u2013 %u2013 (71.4)Consumable supplies 115 031 %u2013 251 %u2013 %u2013 152 %u2013 %u2013 %u2013 (100.0)Consumables: Stationery, printing and office supplies %u2013 %u2013 100 %u2013 %u2013 %u2013 %u2013 %u2013 %u2013Operating leases %u2013 %u2013 %u2013 %u2013 %u2013 %u2013 %u2013 %u2013 %u2013Rental and hiring %u2013 %u2013 %u2013 %u2013 %u2013 %u2013 %u2013 %u2013 %u2013Property payments 56 839 263 800 402 295 583 324 492 202 479 843 499 799 353 491 233 624 4.2Transport provided: Departmental activity %u2013 %u2013 %u2013 %u2013 %u2013 %u2013 %u2013 %u2013 %u2013Travel and subsistence 2 636 5 263 5 628 13 029 13 029 10 132 14 332 14 332 14 782 41.5Training and development %u2013 %u2013 %u2013 %u2013 %u2013 %u2013 %u2013 %u2013 %u2013Operating payments %u2013 32 70 %u2013 %u2013 14 %u2013 %u2013 %u2013 (100.0)Venues and facilities %u2013 %u2013 %u2013 %u2013 %u2013 %u2013 %u2013 %u2013 %u2013Interest and rent on land %u2013 %u2013 1 506 %u2013 %u2013 %u2013 %u2013 %u2013 %u2013Interest (Incl. interest on unitary payments (PPP)) %u2013 %u2013 1 506 %u2013 %u2013 %u2013 %u2013 %u2013 %u2013Rent on land %u2013 %u2013 %u2013 %u2013 %u2013 %u2013 %u2013 %u2013 %u2013Transfers and subsidies %u2013 3 81 %u2013 %u2013 %u2013 %u2013 %u2013 %u2013Provinces and municipalities %u2013 %u2013 %u2013 %u2013 %u2013 %u2013 %u2013 %u2013 %u2013Provinces %u2013 %u2013 %u2013 %u2013 %u2013 %u2013 %u2013 %u2013 %u2013Provincial Revenue Funds %u2013 %u2013 %u2013 %u2013 %u2013 %u2013 %u2013 %u2013 %u2013Provincial agencies and funds %u2013 %u2013 %u2013 %u2013 %u2013 %u2013 %u2013 %u2013 %u2013Municipalities %u2013 %u2013 %u2013 %u2013 %u2013 %u2013 %u2013 %u2013 %u2013Municipal bank accounts %u2013 %u2013 %u2013 %u2013 %u2013 %u2013 %u2013 %u2013 %u2013Municipal agencies and funds %u2013 %u2013 %u2013 %u2013 %u2013 %u2013 %u2013 %u2013 %u2013Departmental agencies and accounts %u2013 %u2013 %u2013 %u2013 %u2013 %u2013 %u2013 %u2013 %u2013Social security funds %u2013 %u2013 %u2013 %u2013 %u2013 %u2013 %u2013 %u2013 %u2013Departmental agencies (non-business entities) %u2013 %u2013 %u2013 %u2013 %u2013 %u2013 %u2013 %u2013 %u2013Higher education institutions %u2013 %u2013 %u2013 %u2013 %u2013 %u2013 %u2013 %u2013 %u2013Foreign governments and international organisations %u2013 %u2013 %u2013 %u2013 %u2013 %u2013 %u2013 %u2013 %u2013Public corporations and private enterprises %u2013 %u2013 %u2013 %u2013 %u2013 %u2013 %u2013 %u2013 %u2013Public corporations %u2013 %u2013 %u2013 %u2013 %u2013 %u2013 %u2013 %u2013 %u2013Subsidies on products and production (pc) %u2013 %u2013 %u2013 %u2013 %u2013 %u2013 %u2013 %u2013 %u2013Other transfers to public corporations %u2013 %u2013 %u2013 %u2013 %u2013 %u2013 %u2013 %u2013 %u2013Private enterprises %u2013 %u2013 %u2013 %u2013 %u2013 %u2013 %u2013 %u2013 %u2013Subsidies on products and production (pe) %u2013 %u2013 %u2013 %u2013 %u2013 %u2013 %u2013 %u2013 %u2013Other transfers to private enterprises %u2013 %u2013 %u2013 %u2013 %u2013 %u2013 %u2013 %u2013 %u2013Non-profit institutions %u2013 23 %u2013 %u2013 %u2013 %u2013 %u2013 %u2013 %u2013Households %u2013 -20 81 %u2013 %u2013 %u2013 %u2013 %u2013 %u2013Social benefits %u2013 %u2013 %u2013 %u2013 %u2013 %u2013 %u2013 %u2013 %u2013Other transfers to households %u2013 -20 81 %u2013 %u2013 %u2013 %u2013 %u2013 %u2013Payments for capital assets 845 450 1 300 390 1 018 437 1 066 634 1 042 059 1 037 835 1 156 055 1 274 406 1 439 628 11.4Buildings and other fixed structures 844 660 1 297 863 1 016 327 1 066 634 1 042 059 1 032 219 1 156 055 1 274 406 1 439 628 12.0Buildings %u2013 %u2013 %u2013 222 145 %u2013 %u2013 %u2013 %u2013 %u2013Other fixed structures 844 660 1 297 863 1 016 327 1 066 634 819 914 1 032 219 1 156 055 1 274 406 1 439 628 12.0Machinery and equipment 790 2 527 2 110 %u2013 %u2013 5 616 %u2013 %u2013 %u2013 (100.0)Transport equipment %u2013 %u2013 %u2013 %u2013 %u2013 %u2013 %u2013 %u2013 %u2013Other machinery and equipment 790 2 527 2 110 %u2013 %u2013 5 616 %u2013 %u2013 %u2013 (100.0)Heritage Assets %u2013 %u2013 %u2013 %u2013 %u2013 %u2013 %u2013 %u2013 %u2013Specialised military assets %u2013 %u2013 %u2013 %u2013 %u2013 %u2013 %u2013 %u2013 %u2013Biological assets %u2013 %u2013 %u2013 %u2013 %u2013 %u2013 %u2013 %u2013 %u2013Land and sub-soil assets %u2013 %u2013 %u2013 %u2013 %u2013 %u2013 %u2013 %u2013 %u2013Software and other intangible assets %u2013 %u2013 %u2013 %u2013 %u2013 %u2013 %u2013 %u2013 %u2013Payments for financial assets %u2013 %u2013 %u2013 %u2013 %u2013 %u2013 %u2013 %u2013 %u2013Total economic classification 1 214 942 1 854 215 1 697 072 1 848 180 1 853 750 1 853 750 1 926 636 1 922 951 2 009 997 3.92024/25 369
