
Page 388 - Demo
P. 388
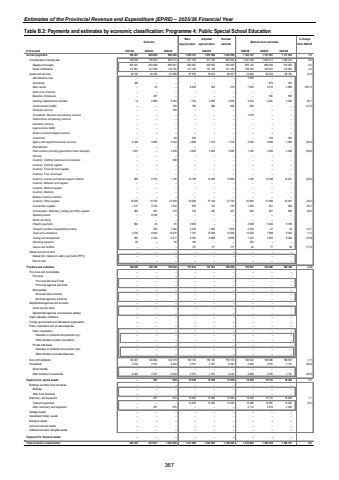
Estimates of the Provincial Revenue and Expenditure (EPRE) %u2013 2025/26 Financial YearTable B.2: Payments and estimates by economic classification: Programme 4: Public Special School Education Outcome Main appropriationAdjusted appropriationRevised estimate Medium-term estimates % change from 2024/25R thousand 2021/22 2022/23 2023/24 2025/26 2026/27 2027/28Current payments 795 047 825 605 892 262 1 059 721 1 051 658 1 025 550 1 102 197 1 127 281 1 177 910 7.5Compensation of employ ees 762 938 776 423 830 273 971 745 971 745 945 543 1 027 248 1 045 271 1 092 210 8.6Salaries and w ages 645 337 654 828 696 081 820 562 820 562 794 360 869 143 880 050 919 554 9.4Social contributions 117 601 121 595 134 192 151 183 151 183 151 183 158 105 165 221 172 656 4.6Goods and serv ices 32 109 49 182 61 989 87 976 79 913 80 007 74 949 82 010 85 700 (6.3)Administrative fees %u2013 %u2013 %u2013 %u2013 %u2013 %u2013 1 050 %u2013 %u2013 Advertising 246 %u2013 %u2013 %u2013 %u2013 %u2013 %u2013 879 919Minor assets %u2013 22 8 294 %u2013 504 510 7 840 3 510 3 668 1437.3Audit costs: External %u2013 %u2013 %u2013 %u2013 %u2013 %u2013 %u2013 %u2013 %u2013Bursaries: Employees %u2013 457 %u2013 %u2013 %u2013 %u2013 %u2013 532 556Catering: Departmental activities 14 2 085 5 364 1 192 3 058 3 058 4 304 2 251 2 352 40.7Communication (G&S) %u2013 %u2013 159 180 290 290 200 %u2013 %u2013 (31.0)Computer services %u2013 %u2013 149 %u2013 %u2013 %u2013 %u2013 %u2013 %u2013Consultants: Business and advisory services %u2013 %u2013 %u2013 %u2013 %u2013 1 040 %u2013 %u2013 %u2013Infrastructure and planning services %u2013 %u2013 %u2013 %u2013 %u2013 %u2013 %u2013 %u2013 %u2013Laboratory services %u2013 %u2013 %u2013 %u2013 %u2013 %u2013 %u2013 %u2013 %u2013Legal services (G&S) %u2013 %u2013 %u2013 %u2013 %u2013 %u2013 %u2013 %u2013 %u2013Science and technological services %u2013 %u2013 %u2013 %u2013 %u2013 %u2013 %u2013 %u2013 %u2013Contractors %u2013 %u2013 59 539 %u2013 %u2013 %u2013 239 249Agency and support/outsourced services 6 446 3 950 2 544 4 680 7 219 7 219 3 000 3 688 3 854 (58.4)Entertainment %u2013 %u2013 %u2013 %u2013 %u2013 %u2013 %u2013 %u2013 %u2013Fleet services (including government motor transport) 1 457 3 259 %u2013 3 626 3 926 3 926 1 350 3 489 3 646 (65.6)Housing %u2013 %u2013 %u2013 %u2013 %u2013 %u2013 %u2013 %u2013 %u2013Inventory: Clothing material and accessories %u2013 %u2013 368 %u2013 %u2013 %u2013 %u2013 %u2013 %u2013Inventory: Farming supplies %u2013 %u2013 %u2013 %u2013 %u2013 %u2013 %u2013 %u2013 %u2013Inventory: Food and food supplies %u2013 %u2013 %u2013 %u2013 %u2013 %u2013 %u2013 %u2013 %u2013Inventory: Fuel, oil and gas %u2013 %u2013 %u2013 %u2013 %u2013 %u2013 %u2013 %u2013 %u2013Inventory: Learner and teacher support material 665 2 734 1 130 13 196 12 800 12 800 1 200 13 398 14 001 (90.6)Inventory: Materials and supplies %u2013 %u2013 %u2013 %u2013 %u2013 %u2013 %u2013 %u2013 %u2013Inventory: Medical supplies %u2013 %u2013 %u2013 %u2013 %u2013 %u2013 %u2013 %u2013 %u2013Inventory: Medicine %u2013 %u2013 %u2013 %u2013 %u2013 %u2013 %u2013 %u2013 %u2013Medsas inventory interface %u2013 %u2013 %u2013 %u2013 %u2013 %u2013 %u2013 %u2013 %u2013Inventory: Other supplies 16 926 13 762 27 858 29 399 27 744 27 744 22 690 31 069 32 467 (18.2)Consumable supplies 1 727 3 416 1 394 593 743 743 1 436 951 994 93.3Consumables: Stationery, printing and office supplies 362 281 315 720 239 327 520 857 895 59.0Operating leases 9 336 %u2013 %u2013 %u2013 %u2013 %u2013 %u2013 %u2013 %u2013Rental and hiring %u2013 %u2013 %u2013 %u2013 %u2013 %u2013 %u2013 %u2013 %u2013Property payments 562 43 81 5 000 %u2013 4 999 %u2013 5 462 5 708Transport provided: Departmental activity %u2013 529 1 425 2 709 1 509 1 509 3 240 27 28 114.7Travel and subsistence 3 330 9 843 12 615 7 781 13 006 13 006 14 468 7 688 8 034 11.2Training and development 352 2 724 5 217 9 760 8 698 8 698 7 322 7 893 8 249 (15.8)Operating payments 22 %u2013 52 180 %u2013 %u2013 250 %u2013 %u2013Venues and facilities %u2013 %u2013 %u2013 127 177 177 40 77 80 (77.4)Interest and rent on land %u2013 %u2013 %u2013 %u2013 %u2013 %u2013 %u2013 %u2013 %u2013Interest (Incl. interest on unitary pay ments (PPP)) %u2013 %u2013 %u2013 %u2013 %u2013 %u2013 %u2013 %u2013 %u2013Rent on land %u2013 %u2013 %u2013 %u2013 %u2013 %u2013 %u2013 %u2013 %u2013Transfers and subsidies 149 429 148 765 150 622 157 914 157 914 160 495 155 407 162 400 169 708 (3.2)Prov inces and municipalities %u2013 %u2013 %u2013 %u2013 %u2013 %u2013 %u2013 %u2013 %u2013Prov inces %u2013 %u2013 %u2013 %u2013 %u2013 %u2013 %u2013 %u2013 %u2013Prov incial Rev enue Funds %u2013 %u2013 %u2013 %u2013 %u2013 %u2013 %u2013 %u2013 %u2013Prov incial agencies and funds %u2013 %u2013 %u2013 %u2013 %u2013 %u2013 %u2013 %u2013 %u2013Municipalities %u2013 %u2013 %u2013 %u2013 %u2013 %u2013 %u2013 %u2013 %u2013Municipal bank accounts %u2013 %u2013 %u2013 %u2013 %u2013 %u2013 %u2013 %u2013 %u2013Municipal agencies and funds %u2013 %u2013 %u2013 %u2013 %u2013 %u2013 %u2013 %u2013 %u2013Departmental agencies and accounts %u2013 %u2013 %u2013 %u2013 %u2013 %u2013 %u2013 %u2013 %u2013Social security funds %u2013 %u2013 %u2013 %u2013 %u2013 %u2013 %u2013 %u2013 %u2013Departmental agencies (non-business entities) %u2013 %u2013 %u2013 %u2013 %u2013 %u2013 %u2013 %u2013 %u2013Higher education institutions %u2013 %u2013 %u2013 %u2013 %u2013 %u2013 %u2013 %u2013 %u2013Foreign gov ernments and international organisations %u2013 %u2013 %u2013 %u2013 %u2013 %u2013 %u2013 %u2013 %u2013Public corporations and priv ate enterprises %u2013 %u2013 %u2013 %u2013 %u2013 %u2013 %u2013 %u2013 %u2013Public corporations %u2013 %u2013 %u2013 %u2013 %u2013 %u2013 %u2013 %u2013 %u2013Subsidies on products and production (pc) %u2013 %u2013 %u2013 %u2013 %u2013 %u2013 %u2013 %u2013 %u2013Other transfers to public corporations %u2013 %u2013 %u2013 %u2013 %u2013 %u2013 %u2013 %u2013 %u2013Priv ate enterprises %u2013 %u2013 %u2013 %u2013 %u2013 %u2013 %u2013 %u2013 %u2013Subsidies on products and production (pe) %u2013 %u2013 %u2013 %u2013 %u2013 %u2013 %u2013 %u2013 %u2013Other transfers to priv ate enterprises %u2013 %u2013 %u2013 %u2013 %u2013 %u2013 %u2013 %u2013 %u2013Non-profit institutions 143 407 144 984 142 373 155 153 155 153 155 153 152 522 159 385 166 557 (1.7)Households 6 022 3 781 8 249 2 761 2 761 5 342 2 885 3 015 3 151 (46.0)Social benefits %u2013 %u2013 %u2013 %u2013 %u2013 %u2013 %u2013 %u2013 %u2013Other transfers to households 6 022 3 781 8 249 2 761 2 761 5 342 2 885 3 015 3 151 (46.0)Payments for capital assets %u2013 467 970 13 450 13 450 13 450 14 399 15 773 16 483 7.1Buildings and other fix ed structures %u2013 %u2013 %u2013 %u2013 %u2013 %u2013 %u2013 %u2013 %u2013Buildings %u2013 %u2013 %u2013 %u2013 %u2013 %u2013 %u2013 %u2013 %u2013Other fix ed structures %u2013 %u2013 %u2013 %u2013 %u2013 %u2013 %u2013 %u2013 %u2013Machinery and equipment %u2013 467 970 13 450 13 450 13 450 14 399 15 773 16 483 7.1Transport equipment %u2013 %u2013 13 450 %u2013 13 450 13 450 12 285 12 957 13 540 (8.7)Other machinery and equipment %u2013 467 970 %u2013 %u2013 2 114 %u2013 2 816 2 943Heritage Assets %u2013 %u2013 %u2013 %u2013 %u2013 %u2013 %u2013 %u2013 %u2013Specialised military assets %u2013 %u2013 %u2013 %u2013 %u2013 %u2013 %u2013 %u2013 %u2013Biological assets %u2013 %u2013 %u2013 %u2013 %u2013 %u2013 %u2013 %u2013 %u2013Land and sub-soil assets %u2013 %u2013 %u2013 %u2013 %u2013 %u2013 %u2013 %u2013 %u2013Softw are and other intangible assets %u2013 %u2013 %u2013 %u2013 %u2013 %u2013 %u2013 %u2013 %u2013Payments for financial assets %u2013 %u2013 %u2013 %u2013 %u2013 %u2013 %u2013 %u2013 %u2013Total economic classification 944 476 974 837 1 043 854 1 231 085 1 223 022 1 199 495 1 272 003 1 305 454 1 364 101 6.02024/25367
