
Page 528 - Demo
P. 528
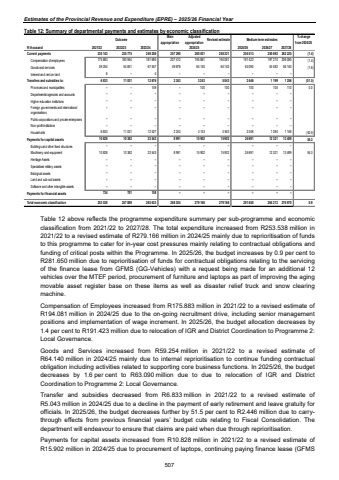
Estimates of the Provincial Revenue and Expenditure (EPRE) %u2013 2025/26 Financial YearTable 12: Summary of departmental payments and estimates by economic classification Outcome Main appropriationAdjusted appropriation Revised estimate Medium-term estimates % change from 2024/25R thousand 2021/22 2022/23 2023/24 2025/26 2026/27 2027/28Current payments 235 775 235 143 249 256 257 290 260 021 258 221 254 513 250 692 262 225 (1.4)Compensation of employees 180 944 175 883 181 695 207 412 195 881 194 081 191 423 197 210 206 085 (1.4)Goods and services 54 831 59 254 67 557 49 878 64 140 64 140 63 090 53 482 56 140 (1.6)Interest and rent on land 6 %u2013 4 %u2013 %u2013 %u2013 %u2013 %u2013 %u2013Transfers and subsidies to: 6 833 11 031 12 676 2 243 3 243 5 043 2 446 1 256 1 199 (51.5)Provinces and municipalities %u2013 %u2013 149 %u2013 100 100 100 110 105 0.0Departmental agencies and accounts %u2013 %u2013 %u2013 %u2013 %u2013 %u2013 %u2013 %u2013 %u2013Higher education institutions %u2013 %u2013 %u2013 %u2013 %u2013 %u2013 %u2013 %u2013 %u2013Foreign governments and international organisations %u2013 %u2013 %u2013 %u2013 %u2013 %u2013 %u2013 %u2013 %u2013Public corporations and private enterprises %u2013 %u2013 %u2013 %u2013 %u2013 %u2013 %u2013 %u2013 %u2013Non-profit institutions %u2013 %u2013 %u2013 %u2013 %u2013 %u2013 %u2013 %u2013 %u2013Households 6 833 11 031 12 527 2 243 3 143 4 943 2 346 1 146 1 094 (52.5)Payments for capital assets 10 828 10 382 23 543 8 991 15 902 15 902 24 691 13 489 12 321 55.3Buildings and other fixed structures %u2013 %u2013 %u2013 %u2013 %u2013 %u2013 %u2013 %u2013 %u2013Machinery and equipment 10 828 10 382 23 543 8 991 15 902 15 902 24 691 13 489 12 321 55.3Heritage Assets %u2013 %u2013 %u2013 %u2013 %u2013 %u2013 %u2013 %u2013 %u2013Specialised military assets %u2013 %u2013 %u2013 %u2013 %u2013 %u2013 %u2013 %u2013 %u2013Biological assets %u2013 %u2013 %u2013 %u2013 %u2013 %u2013 %u2013 %u2013 %u2013Land and sub-soil assets %u2013 %u2013 %u2013 %u2013 %u2013 %u2013 %u2013 %u2013 %u2013Software and other intangible assets %u2013 %u2013 %u2013 %u2013 %u2013 %u2013 %u2013 %u2013 %u2013Payments for financial assets 734 701 158 %u2013 %u2013 %u2013 %u2013 %u2013 %u2013Total economic classification 253 538 257 889 285 633 268 524 279 166 279 166 281 650 276 970 264 212 0.92024/25Table 12 above reflects the programme expenditure summary per sub-programme and economic classification from 2021/22 to 2027/28. The total expenditure increased from R253.538 million in 2021/22 to a revised estimate of R279.166 million in 2024/25 mainly due to reprioritisation of funds to this programme to cater for in-year cost pressures mainly relating to contractual obligations and funding of critical posts within the Programme. In 2025/26, the budget increases by 0.9 per cent to R281.650 million due to reprioritisation of funds for contractual obligations relating to the servicing of the finance lease from GFMS (GG-Vehicles) with a request being made for an additional 12 vehicles over the MTEF period, procurement of furniture and laptops as part of improving the aging movable asset register base on these items as well as disaster relief truck and snow clearing machine. Compensation of Employees increased from R175.883 million in 2021/22 to a revised estimate of R194.081 million in 2024/25 due to the on-going recruitment drive, including senior management positions and implementation of wage increment. In 2025/26, the budget allocation decreases by 1.4 per cent to R191.423 million due to relocation of IGR and District Coordination to Programme 2: Local Governance. Goods and Services increased from R59.254 million in 2021/22 to a revised estimate of R64.140 million in 2024/25 mainly due to internal reprioritisation to continue funding contractual obligation including activities related to supporting core business functions. In 2025/26, the budget decreases by 1.6 per cent to R63.090 million due to due to relocation of IGR and District Coordination to Programme 2: Local Governance. Transfer and subsidies decreased from R6.833 million in 2021/22 to a revised estimate of R5.043 million in 2024/25 due to a decline in the payment of early retirement and leave gratuity for officials. In 2025/26, the budget decreases further by 51.5 per cent to R2.446 million due to carrythrough effects from previous financial years%u2019 budget cuts relating to Fiscal Consolidation. The department will endeavour to ensure that claims are paid when due through reprioritisation. Payments for capital assets increased from R10.828 million in 2021/22 to a revised estimate of R15.902 million in 2024/25 due to procurement of laptops, continuing paying finance lease (GFMS 507
