
Page 587 - Demo
P. 587
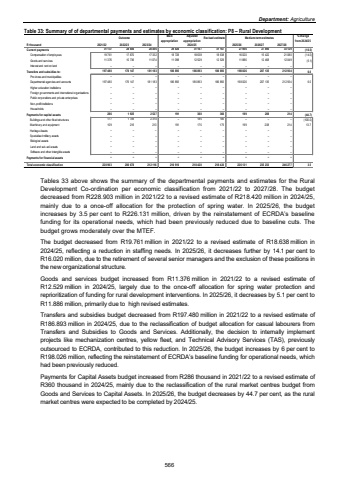
Department: AgricultureTable 33: Summary of of departmental payments and estimates by economic classification: P8 %u2013 Rural Development Outcome Main appropriationAdjusted appropriation Revised estimate Medium-term estimates % change from 2024/25R thousand 2021/22 2022/23 2023/24 2025/26 2026/27 2027/28Current payments 28 606 31 137 28 406 29 826 31 167 31 167 27 906 27 890 33 129 (10.5)Compensation of employees 17 870 19 761 17 332 18 728 18 638 18 638 16 020 15 422 21 080 (14.0)Goods and services 10 736 11 376 11 074 11 098 12 529 12 529 11 886 12 468 12 049 (5.1)Interest and rent on land %u2013 %u2013 %u2013 %u2013 %u2013 %u2013 %u2013 %u2013 %u2013 Transfers and subsidies to: 176 147 197 480 181 183 186 893 186 893 186 893 198 026 207 135 212 934 6.0Provinces and municipalities %u2013 %u2013 %u2013 %u2013 %u2013 %u2013 %u2013 %u2013 %u2013 Departmental agencies and accounts 176 147 197 480 181 183 186 893 186 893 186 893 198 026 207 135 212 934 6.0Higher education institutions %u2013 %u2013 %u2013 %u2013 %u2013 %u2013 %u2013 %u2013 %u2013Foreign governments and international organisations %u2013 %u2013 %u2013 %u2013 %u2013 %u2013 %u2013 %u2013 %u2013Public corporations and private enterprises %u2013 %u2013 %u2013 %u2013 %u2013 %u2013 %u2013 %u2013 %u2013Non-profit institutions %u2013 %u2013 %u2013 %u2013 %u2013 %u2013 %u2013 %u2013 %u2013Households %u2013 %u2013 %u2013 %u2013 %u2013 %u2013 %u2013 %u2013 %u2013Payments for capital assets 286 1 925 2 527 191 360 360 199 208 214 (44.7)Buildings and other fixed structures 177 1 709 2 314 %u2013 185 185 %u2013 %u2013 %u2013 (100.0)Machinery and equipment 109 216 213 191 175 175 199 208 214 13.7Heritage Assets %u2013 %u2013 %u2013 %u2013 %u2013 %u2013 %u2013 %u2013 %u2013Specialised military assets %u2013 %u2013 %u2013 %u2013 %u2013 %u2013 %u2013 %u2013 %u2013Biological assets %u2013 %u2013 %u2013 %u2013 %u2013 %u2013 %u2013 %u2013 %u2013Land and sub-soil assets %u2013 %u2013 %u2013 %u2013 %u2013 %u2013 %u2013 %u2013 %u2013Software and other intangible assets %u2013 %u2013 %u2013 %u2013 %u2013 %u2013 %u2013 %u2013 %u2013Payments for financial assets %u2013 %u2013 %u2013 %u2013 %u2013 %u2013 %u2013 %u2013 %u2013Total economic classification 228 903 206 678 212 116 216 910 218 420 218 420 226 131 235 233 246 277 3.52024/25 Tables 33 above shows the summary of the departmental payments and estimates for the Rural Development Co-ordination per economic classification from 2021/22 to 2027/28. The budget decreased from R228.903 million in 2021/22 to a revised estimate of R218.420 million in 2024/25, mainly due to a once-off allocation for the protection of spring water. In 2025/26, the budget increases by 3.5 per cent to R226.131 million, driven by the reinstatement of ECRDA%u2019s baseline funding for its operational needs, which had been previously reduced due to baseline cuts. The budget grows moderately over the MTEF. The budget decreased from R19.761 million in 2021/22 to a revised estimate of R18.638 million in 2024/25, reflecting a reduction in staffing needs. In 2025/26, it decreases further by 14.1 per cent to R16.020 million, due to the retirement of several senior managers and the exclusion of these positions in the new organizational structure. Goods and services budget increased from R11.376 million in 2021/22 to a revised estimate of R12.529 million in 2024/25, largely due to the once-off allocation for spring water protection and reprioritization of funding for rural development interventions. In 2025/26, it decreases by 5.1 per cent to R11.886 million, primarily due to high revised estimates. Transfers and subsidies budget decreased from R197.480 million in 2021/22 to a revised estimate of R186.893 million in 2024/25, due to the reclassification of budget allocation for casual labourers from Transfers and Subsidies to Goods and Services. Additionally, the decision to internally implement projects like mechanization centres, yellow fleet, and Technical Advisory Services (TAS), previously outsourced to ECRDA, contributed to this reduction. In 2025/26, the budget increases by 6 per cent to R198.026 million, reflecting the reinstatement of ECRDA%u2019s baseline funding for operational needs, which had been previously reduced. Payments for Capital Assets budget increased from R286 thousand in 2021/22 to a revised estimate of R360 thousand in 2024/25, mainly due to the reclassification of the rural market centres budget from Goods and Services to Capital Assets. In 2025/26, the budget decreases by 44.7 per cent, as the rural market centres were expected to be completed by 2024/25. 566
