
Page 588 - Demo
P. 588
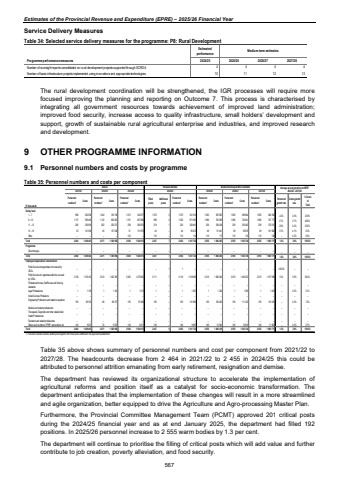
Estimates of the Provincial Revenue and Expenditure (EPRE) %u2013 2025/26 Financial YearService Delivery Measures Table 34: Selected service delivery measures for the programme: P8: Rural Development Estimatedperformance Medium-term estimatesProgramme performance measures 2024/25 2025/26 2026/27 2027/28Number of oversight reports consolidated on rural development projects supported through ECRDA 4 4 4 4 Number of basic infrastructure projects implemented using innovations and appropriate technologies. 11 10 12 13 The rural development coordination will be strengthened, the IGR processes will require more focused improving the planning and reporting on Outcome 7. This process is characterised by integrating all government resources towards achievement of improved land administration; improved food security, increase access to quality infrastructure, small holders%u2019 development and support, growth of sustainable rural agricultural enterprise and industries, and improved research and development. 9 OTHER PROGRAMME INFORMATION 9.1 Personnel numbers and costs by programme Table 35: Personnel numbers and costs per component Actual Revised estimate Medium-term expenditure estimateR thousandsPersonnel numbers1 Costs Personnel numbers1 Costs Personnel numbers1 Costs Filled postsAdditional postsPersonnel numbers1 Costs Personnel numbers1 Costs Personnel numbers1 Costs Personnel numbers1 Costs Personnel growth rate Costs growth rate % Costs of Total Salary level1 %u2013 7 988 302 038 1 042 316 746 1 015 324 077 1 070 2 1 072 341 614 1 065 355 952 1 065 369 844 1 065 384 350 -0.2% 4.0% 23.9%8 %u2013 10 1 157 589 428 1 122 605 035 1 191 667 088 998 4 1 002 671 081 1 086 700 296 1 086 724 641 1 086 747 717 2.7% 3.7% 46.8%11 %u2013 12 266 236 939 262 252 071 258 260 874 219 1 220 328 441 239 338 624 239 353 462 239 372 013 2.8% 4.2% 23.0%13 %u2013 16 53 121 038 45 127 040 51 131 976 44 %u2013 44 90 472 49 91 441 49 95 676 49 101 962 3.7% 4.1% 6.3%Other %u2013 %u2013 %u2013 %u2013 123 %u2013 116 %u2013 116 114 116 117 116 123 116 129 %u2013 4.2% 0.0%Total 2 464 1 249 443 2 471 1 300 892 2 638 1 384 015 2 447 7 2 454 1 431 722 2 555 1 486 430 2 555 1 543 746 2 555 1 606 171 1.4% 3.9% 100.0%ProgrammeDirect charges %u2013 %u2013 %u2013 %u2013 %u2013 %u2013 %u2013 %u2013 %u2013 %u2013 %u2013 %u2013 %u2013 %u2013 %u2013 %u2013 %u2013 %u2013 %u2013Total 2 464 1 249 443 2 471 1 300 892 2 638 1 384 015 2 447 7 2 454 1 431 722 2 555 1 486 430 2 555 1 543 746 2 555 1 606 171 1.4% 3.9% 100.0%Employee dispensation classificationPublic Service Act appointees not covered by OSDs %u2013 %u2013 %u2013 %u2013 %u2013 %u2013 %u2013 1 1 %u2013 %u2013 %u2013 %u2013 %u2013 %u2013 %u2013 -100.0% %u2013 %u2013Public Service Act appointees still to be covered by OSDs 2 128 1 150 162 2 310 1 202 281 2 302 1 275 845 2 111 7 2 118 1 318 695 2 219 1 368 340 2 219 1 420 223 2 219 1 477 090 1.6% 3.9% 92.0%Professional Nurses, Staff Nurses and Nursing Assistants %u2013 %u2013 %u2013 %u2013 %u2013 %u2013 %u2013 %u2013 %u2013 %u2013 %u2013 %u2013 %u2013 %u2013 %u2013 %u2013 %u2013 %u2013 %u2013Legal Professionals 1 1 109 1 1 162 1 1 213 1 %u2013 1 1 267 1 1 324 1 1 385 1 1 447 %u2013 4.5% 0.1%Social Services Professions %u2013 %u2013 %u2013 %u2013 %u2013 %u2013 %u2013 %u2013 %u2013 %u2013 %u2013 %u2013 %u2013 %u2013 %u2013 %u2013 %u2013 %u2013 %u2013Engineering Professions and related occupations 195 89 100 86 88 377 195 97 486 195 %u2013 195 101 863 195 106 426 195 111 322 195 116 331 %u2013 4.5% 7.2%Medical and related professionals %u2013 %u2013 %u2013 %u2013 %u2013 %u2013 %u2013 %u2013 %u2013 %u2013 %u2013 %u2013 %u2013 %u2013 %u2013 %u2013 %u2013 %u2013 %u2013Therapeutic, Diagnostic and other related Allied Health Professionals %u2013 %u2013 %u2013 %u2013 %u2013 %u2013 %u2013 %u2013 %u2013 %u2013 %u2013 %u2013 %u2013 %u2013 %u2013 %u2013 %u2013 %u2013 %u2013Educators and related professionals %u2013 %u2013 %u2013 %u2013 %u2013 %u2013 %u2013 %u2013 %u2013 %u2013 %u2013 %u2013 %u2013 %u2013 %u2013 %u2013 %u2013 %u2013 %u2013Others such as interns, EPWP, learnerships, etc 140 9 072 74 9 072 140 9 471 140 %u2013 140 9 897 140 10 340 140 10 816 140 11 303 %u2013 4.5% 0.7%Total 2 464 1 249 443 2 471 1 300 892 2 638 1 384 015 2 447 8 2 455 1 431 722 2 555 1 486 430 2 555 1 543 746 2 555 1 606 171 1.3% 3.9% 100.0%1. Personnel numbers includes all filled posts together with those posts additional to the approved establishment Average annual growth over MTEF 2021/22 2022/23 2023/24 2024/25 2025/26 2026/27 2027/28 2024/25 - 2027/28 Table 35 above shows summary of personnel numbers and cost per component from 2021/22 to 2027/28. The headcounts decrease from 2 464 in 2021/22 to 2 455 in 2024/25 this could be attributed to personnel attrition emanating from early retirement, resignation and demise. The department has reviewed its organizational structure to accelerate the implementation of agricultural reforms and position itself as a catalyst for socio-economic transformation. The department anticipates that the implementation of these changes will result in a more streamlined and agile organization, better equipped to drive the Agriculture and Agro-processing Master Plan. Furthermore, the Provincial Committee Management Team (PCMT) approved 201 critical posts during the 2024/25 financial year and as at end January 2025, the department had filled 192 positions. In 2025/26 personnel increase to 2 555 warm bodies by 1.3 per cent. The department will continue to prioritise the filling of critical posts which will add value and further contribute to job creation, poverty alleviation, and food security. 567
