
Page 591 - Demo
P. 591
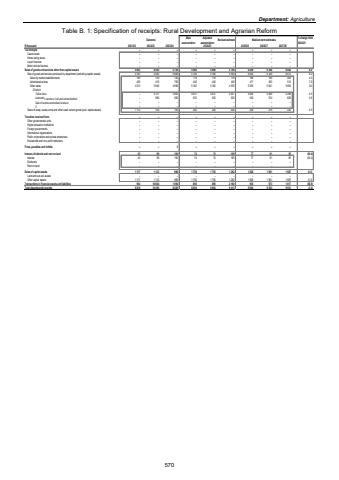
Department: AgricultureTable B. 1: Specification of receipts: Rural Development and Agrarian Reform Outcome Main appropriationAdjusted appropriation Revised estimate Medium-term estimates % change from 2024/25R thousand 2021/22 2022/23 2023/24 2025/26 2026/27 2027/28Tax receipts %u2013 %u2013 %u2013 %u2013 %u2013 %u2013 %u2013 %u2013 %u2013Casino taxes %u2013 %u2013 %u2013 %u2013 %u2013 %u2013 %u2013 %u2013 %u2013Horse racing taxes %u2013 %u2013 %u2013 %u2013 %u2013 %u2013 %u2013 %u2013 %u2013Liquor licences %u2013 %u2013 %u2013 %u2013 %u2013 %u2013 %u2013 %u2013 %u2013Motor vehicle licences %u2013 %u2013 %u2013 %u2013 %u2013 %u2013 %u2013 %u2013 %u2013Sales of goods and services other than capital assets 5 903 4 585 5 758 5 980 5 980 5 794 6 259 6 548 6 842 8.0Sale of goods and services produced by department (excluding capital assets) 4 485 4 790 5 608 5 780 5 780 5 594 6 050 6 329 6 613 8.2Sales by market establishments 149 129 120 178 178 178 186 195 204 4.5Administrative fees 410 428 790 440 440 440 471 493 515 7.0Other sales 3 946 4 213 4 698 5 162 5 162 4 976 5 393 5 641 5 894 8.4Of whichTuition fees %u2013 4 121 3 904 4 637 4 637 4 637 4 845 5 068 5 296 4.5Laboratory services ( soil and animal testing) %u2013 986 500 525 525 525 549 574 600 4.6Sale of surplus agricultural produce %u2013 %u2013 %u2013 %u2013 %u2013 %u2013 %u2013 %u2013 %u20130 %u2013 %u2013 %u2013 %u2013 %u2013 %u2013 %u2013 %u2013 %u2013Sales of scrap, waste, arms and other used current goods (excl. capital assets) 100 1 113 150 200 200 200 209 219 229 4.5Transfers received from: %u2013 %u2013 %u2013 %u2013 %u2013 %u2013 %u2013 %u2013 %u2013Other governmental units %u2013 %u2013 %u2013 %u2013 %u2013 %u2013 %u2013 %u2013 %u2013Higher education institutions %u2013 %u2013 %u2013 %u2013 %u2013 %u2013 %u2013 %u2013 %u2013Foreign governments %u2013 %u2013 %u2013 %u2013 %u2013 %u2013 %u2013 %u2013 %u2013International organisations %u2013 %u2013 %u2013 %u2013 %u2013 %u2013 %u2013 %u2013 %u2013Public corporations and private enterprises %u2013 %u2013 %u2013 %u2013 %u2013 %u2013 %u2013 %u2013 %u2013Households and non-profit institutions %u2013 %u2013 %u2013 %u2013 %u2013 %u2013 %u2013 %u2013 %u2013Fines, penalties and forfeits %u2013 %u2013 3 %u2013 %u2013 %u2013 %u2013 %u2013 %u2013Interest, dividends and rent on land 45 98 194 74 74 169 77 81 85 (54.4)Interest 98 45 194 74 74 169 77 81 85 (54.4)Dividends %u2013 %u2013 %u2013 %u2013 %u2013 %u2013 %u2013 %u2013 %u2013Rent on land %u2013 %u2013 %u2013 %u2013 %u2013 %u2013 %u2013 %u2013 %u2013Sales of capital assets 1 123 1 117 980 1 750 1 750 1 292 1 828 1 901 1 987 41.5Land and sub-soil assets %u2013 %u2013 %u2013 %u2013 %u2013 %u2013 %u2013 %u2013 %u2013Other capital assets 1 123 1 117 980 1 750 1 750 1 292 1 828 1 901 1 987 41.5Transactions in financial assets and liabilities 954 10 684 1 094 890 890 2 160 930 973 1 017 (56.9)Total departmental receipts 16 490 8 019 8 029 8 694 8 694 9 415 9 094 9 503 9 931 (3.4)2024/25570
