
Page 668 - Demo
P. 668
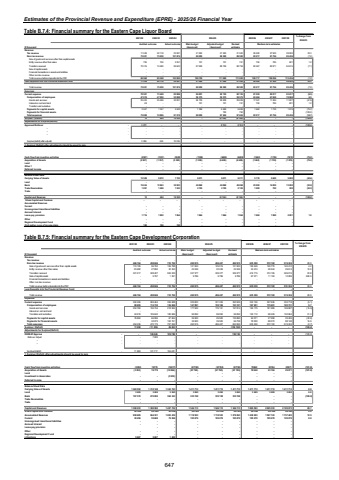
Estimates of the Provincial Revenue and Expenditure (EPRE) - 2025/26 Financial Year Table B.7.4: Financial summary for the Eastern Cape Liquor Board 2021/22 2022/23 2023/24 2024/25 2025/26 2026/27 2027/28 % change from 2024/25R thousand Audited outcome Actual outcome Main budget (Approved)Adjusted budget (Approved)Revised estimateRevenueTax revenue 11 539 20 118 22 081 21 500 21 500 21 500 26 500 27 500 28 000 23.3Non-tax revenue 73 021 75 230 101 874 88 250 89 500 89 500 83 217 81 756 85 436 (7.0)Sale of goods and services other than capital assets - - - - - - - - -Entity revenue other than sales 705 750 2 251 741 741 741 750 785 821 1.2Transfers received 72 316 74 480 99 623 87 509 88 759 88 759 82 467 80 971 84 615 (7.1)Sale of capital assets - - - - - - - - -Financial transactions in assets and liabilities - - - - - - - - -Other non-tax revenue - - - - - - - - -Total revenue before deposits into the PRF 84 560 95 348 123 955 109 750 111 000 111 000 109 717 109 256 113 436 (1.2)Less Deposits into the Provincial Revenue Fund 11 539 20 118 22 081 21 500 21 500 21 500 26 500 27 500 28 000 23.3Total revenue 73 021 75 230 101 874 88 250 89 500 89 500 83 217 81 756 85 436 (7.0)ExpensesCurrent expense 70 501 73 449 85 999 86 851 90 155 90 155 81 555 80 017 83 617 (9.5)Compensation of employees 47 019 47 950 55 998 59 375 59 575 59 575 63 464 67 848 70 969 6.5Goods and services 23 433 25 499 30 001 26 735 29 839 29 839 17 341 11 384 11 827 (41.9)Interest on rent and land 49 - - 741 741 741 750 785 821 1.2Transfers and subsidies - - - - - - - - -Payments for capital assets 2 507 1 357 5 520 1 399 6 699 6 699 1 662 1 739 1 819 (75.2)Payments for financial assets - - - - 750 750 - - - (100.0)Total expenses 73 008 74 806 91 519 88 250 97 604 97 604 83 217 81 756 85 436 (14.7)Surplus / (Deficit) 13 424 10 355 - (8 104) (8 104) - - - (100.0)Adjustments for Surplus/(Deficit)Approved Rollover - 3 271 - - - 8 104 8 104 - - - (100.0) %u2013 - - - - - - - - - - %u2013 - - - - - - - - - - %u2013 - - - - - - - - - -Surplus/(deficit) after adjustm - 3 284 424 10 355 - - - - - -1. Surplus/ (Deficit) after adjustments should be equal to zero.Cash flow from investing activities (2507) (1357) (5520) (1399) (6699) (6699) (1662) (1739) (1819) (75.2)Acquisition of Assets (2 507) (1 357) (5 520) (1 399) (6 699) (6 699) (1 662) (1 739) (1 819) (75.2)Land - - - - - - - - -Other 1 - - - - - - - - -Deferred Income - - - - - - - - -Balance Sheet DataCarrying Value of Assets 13 528 9 972 7 703 9 011 9 011 9 011 5 170 5 600 5 800 (42.6)Land - - - - - - - - -Bank 15 634 13 863 30 923 49 868 49 868 49 868 23 000 14 000 13 000 (53.9)Trade Receivables 1 091 1 498 1 523 2 105 2 105 2 105 1 000 700 300 (52.5)Trade - - - - - - - - -Capital and Reserves 13 424 10 355 - (8 104) (8 104) - - - (100.0)Share Capital and Premium - - - - - - - - - Accumulated ReservesCurrent - - - - - - - - -Unrecognised transitional liabilities - - - - - - - - -Accrued Interest - - - - - - - - -Leave pay provision 1 716 1 802 1 964 1 964 1 964 1 964 1 984 1 990 2 001 1.0Other - - - - - - - - -Regional Development Fund - - - - - - - - -Civil matter- Loss of income claim 180 180 180 - - - - - -Medium-term estimatesTable B.7.5: Financial summary for the Eastern Cape Development Corporation 2021/22 2022/23 2023/24 2024/25 2025/26 2026/27 2027/28 % change from 2024/25R thousand Audited outcome Actual outcome Main budget (Approved)Adjusted budget (Approved)Revised estimateRevenueTax revenue - - - - - - - - -Non-tax revenue 466 194 458 846 733 792 490 915 496 427 492 915 635 309 572 102 574 324 28.9Sale of goods and services other than capital assets 119 195 96 792 106 788 121 503 125 015 121 503 126 549 159 770 163 412 4.2Entity revenue other than sales 25 982 27 850 32 393 22 249 22 249 22 249 24 474 26 944 29 613 10.0Transfers received 321 017 328 407 593 220 337 377 339 377 339 377 416 715 374 195 369 010 22.8Sale of capital assets 5 797 - 1 391 9 786 9 786 9 786 67 571 11 193 12 289 590.5Financial transactions in assets and liabilities - - - - - - - - -Other non-tax revenue - - - - - - - - -Total revenue before deposits into the PRF 466 194 458 846 733 792 490 915 496 427 492 915 635 309 572 102 574 324 28.9Less Deposits into the Provincial Revenue Fund - - - - - - - - -Total revenue 466 194 458 846 733 792 490 915 496 427 492 915 635 309 572 102 574 324 28.9ExpensesCurrent expense 352 455 265 464 355 688 325 823 331 335 350 935 333 126 357 636 353 718 (5.1)Compensation of employees 98 695 114 730 136 696 147 891 155 184 153 121 167 951 175 651 183 731 9.7Goods and services 253 760 150 734 218 992 177 932 176 151 197 814 165 175 181 985 169 987 (16.5)Interest on rent and land - - - - - - - - -Transfers and subsidies 24 918 105 642 180 686 99 092 99 092 99 092 130 112 98 435 102 963 31.3Payments for capital assets 76 863 66 996 67 964 26 500 26 500 135 890 94 071 27 958 29 495 (30.8)Payments for financial assets 32 073 - 102 761 39 500 39 500 66 738 78 000 88 073 88 148 16.9Total expenses 454 236 470 175 707 099 490 915 496 427 652 655 635 309 572 102 574 324 (2.7)Surplus / (Deficit) 11 958 (11 329) 26 693 - (159 740) - - - - (100.0)Adjustments for Surplus/(Deficit)DEDEAT Approve - 126 046 - 129 788 - 159 740 - - - (100.0)Rollover Adjust - 7 000 - - - - - - - - %u2013 - - - - - - - - - %u2013 - - - - - - - - - - Surplus/(deficit) - 11 958 121 717 156 481 - - - - - - 1. Surplus/ (Deficit) after adjustments should be equal to zero.Cash flow from investing activities (3382) 19779 (14817) (97765) (97765) (97765) 79960 23764 25071 (181.8)Acquisition of Assets (3 382) 19 779 (10 864) (97 765) (97 765) (97 765) 79 960 23 764 25 071 (181.8)Land - - - - - -Investment in Associates - (3 953) - - - - - - -Deferred Income - - - - - - - - -Balance Sheet DataCarrying Value of Assets 1 348 552 1 312 148 1 343 793 1 411 713 1 411 713 1 411 713 1 411 713 1 411 713 1 411 713 0.0Land 3 265 3 265 3 265 3 265 3 265 3 265 3 265 3 265 3 265 0.0Bank 197 370 272 095 362 343 335 158 335 158 335 158 - - - (100.0)Trade Receivables - - - - - - - - -Trade - - - - - - - - -Capital and Reserves 1 390 233 1 380 582 1 457 722 1 546 113 1 546 113 1 546 113 1 865 593 2 025 333 2 185 073 20.7Share Capital and Premium 427590 427590 427590 427590 427590 427590 427590 427590 427590 0.0Accumulated Reserves 950 685 964 321 1 003 439 1 118 523 1 118 523 1 278 263 1 438 003 1 597 743 1 757 483 12.5Current 30 456 55 669 79 266 105 270 105 270 105 270 105 270 105 270 105 270 0.0Unrecognised transitional liabilities - - - - - - - - -Accrued Interest - - - - - - - - -Leave pay provision - - - - - - - -Other - - - - - - - - -Regional Development Fund - - - - - - - - -Litigations 5 687 5 687 1 400 - - - - - -Medium-term estimates 647
