
Page 666 - Demo
P. 666
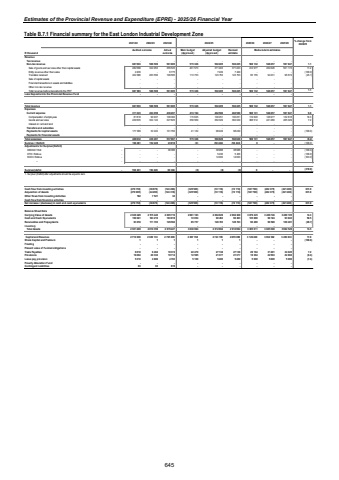
Estimates of the Provincial Revenue and Expenditure (EPRE) - 2025/26 Financial Year Table B.7.1 Financial summary for the East London Industrial Development Zone 2021/22 2022/23 2023/24 2024/25 2025/26 2026/27 2027/28 % change from 2024/25R thousand Audited outcome Actual outcomeMain budget (Approved)Adjusted budget (Approved)Revised estimateRevenueTax revenue - - - - - - - - -Non-tax revenue 687 093 588 509 561 885 515 326 502 405 502 405 508 132 548 257 597 847 1.1Sale of goods and services other than capital assets 282 588 324 953 355 525 401 573 371 403 371 403 412 977 454 026 501 173 11.2Entity revenue other than sales 2 409 6 775 - - 7 249 7 249 - - (100.0) -Transfers received 402 096 263 556 199 585 113 753 123 753 123 753 95 155 94 231 96 674 (23.1)Sale of capital assets - - - - - - - - -Financial transactions in assets and liabilities - - - - - - - - -Other non-tax revenue - - - - - - - - -Total revenue before deposits into the PRF 687 093 588 509 561 885 515 326 502 405 502 405 508 132 548 257 597 847 1.1Less Deposits into the Provincial Revenue Fund - - - - - - - - -Total revenue 687 093 588 509 561 885 515 326 502 405 502 405 508 132 548 257 597 847 1.1ExpensesCurrent expense 311 323 404 059 436 207 474 194 462 580 462 580 508 131 548 257 597 847 9.8Compensation of employees 81 818 99 937 108 382 115 625 100 251 100 251 119 620 126 977 132 818 19.3Goods and services 229 505 304 122 327 825 358 569 362 329 362 329 388 512 421 280 465 029 7.2Interest on rent and land - - - - - - - - -Transfers and subsidies - - - - - - - - -Payments for capital assets 177 309 32 222 101 760 41 132 98 249 98 249 - - (100.0) -Payments for financial assets - - - - - - - - -Total expenses 488 632 436 281 537 967 515 326 560 829 560 829 508 131 548 257 597 847 (9.4)Surplus / (Deficit) 198 461 152 228 23 918 (0) (58 424) (58 424) 0 - - (100.0)Adjustments for Surplus/(Deficit)DEDEAT Roll - - 36 386 - - 38 988 38 988 - - (100.0) -DTIC Rollove - - - - - 5 436 5 436 - - (100.0) -ECDC Rollove - - - - - 14 000 14 000 - - - (100.0) %u2013 - - - - - - - - - -Surplus/(defici 198 - 152 228 461 60 304 (0) (0) (0) 0 - - (319.9)1. Surplus/ (Deficit) after adjustments should be equal to zero.Cash flow from investing activities (279 793) (36 679) (124 286) (325 509) (72 116) (72 116) (527 790) (462 375) (221 400) 631.9Acquisition of Assets (279 985) (44 200) (124 318) (325 509) (72 116) (72 116) (527 790) (462 375) (221 400) 631.9Other flows from Investing Activities 192 7 521 32 - - - - - -Cash flow from financing activities - - - - - - - - -Net increase / (decrease) in cash and cash equivalents (279 793) (36 679) (124 286) (325 509) (72 116) (72 116) (527 790) (462 375) (221 400) 631.9Balance Sheet DataCarrying Value of Assets 2 639 429 2 515 440 2 665 716 2 881 183 2 694 029 2 694 029 3 079 245 3 406 746 3 489 105 14.3Cash and Cash Equivalents 199 041 183 216 183 918 72 054 90 263 90 263 135 886 99 124 93 943 50.5Receivables and Prepayments 93 018 111 703 129 592 85 757 128 703 128 703 90 480 99 528 109 481 (29.7)Inventory - - - - - - - - -Total Assets 2 931 489 2 810 359 2 979 227 3 038 994 2 912 994 2 912 994 3 305 611 3 605 398 3 692 529 13.5Capital and Reserves 2 716 606 2 639 133 2 795 865 2 867 768 2 743 195 2 655 099 3 126 468 3 394 582 3 452 833 17.8Share Capital and Premium 1 1 1 1 1 1 - - (100.0) -Floating - - - - - - - - -Present value of Funded obligations - - - - - - - - -Trade Payables 6 018 6 484 18 374 22 470 27 138 27 138 29 104 31 491 34 045 7.2Provisions 18 294 20 332 19 714 12 585 21 377 21 377 19 364 22 563 22 802 (9.4)Leave pay provision 5 310 4 886 4 783 5 100 5 400 5 400 5 000 5 000 5 000 (7.4)Poverty Alleviation Fund - - - - - - - - -Contingent Liabilities 63 63 619 - - - - - -Medium-term estimates645
