
Page 667 - Demo
P. 667
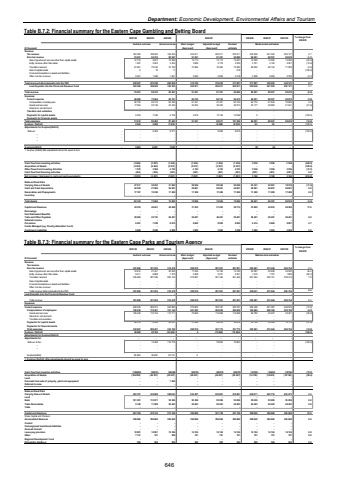
Department: Economic Development, Environmental Affairs and TourismTable B.7.2: Financial summary for the Eastern Cape Gambling and Betting Board 2021/22 2022/23 2023/24 2024/25 2025/26 2026/27 2027/28 % change from 2024/25R thousand Audited outcome Actual outcome Main budget (Approved)Adjusted budget (Approved)Revised estimateRevenueTax revenue 160 300 188 040 184 263 224 911 224 911 224 911 230 946 241 525 253 131 2.7Non-tax revenue 76 557 84 510 85 567 91 241 91 321 92 690 86 951 88 527 92 610 (6.2)Sale of goods and services other than capital assets 10 719 9 873 10 566 15 113 15 113 15 437 12 000 13 000 13 500 (22.3)Entity revenue other than sales 1 367 2 923 3 204 3 696 3 776 4 335 3 791 4 120 4 201 (12.6)Transfers received 61 961 70 043 70 725 70 382 70 382 70 382 68 952 68 143 71 209 (2.0)Sale of capital assets 9 75 11 - - 218 - - - (100.0)Financial transactions in assets and liabilities - - - - - - - - -Other non-tax revenue 2 501 1 596 1 061 2 050 2 050 2 318 2 208 3 264 3 700 (4.7)Total revenue before deposits into the PRF 236 857 272 550 269 830 316 152 316 232 317 601 317 897 330 052 345 741 0.1Less Deposits into the Provincial Revenue Fund 160 300 188 040 184 263 224 911 224 911 224 911 230 946 241 525 253 131 2.7Total revenue 76 557 84 510 85 567 91 241 91 321 92 690 86 951 88 527 92 610 (6.2)ExpensesCurrent expense 68 689 75 062 82 761 86 725 86 723 90 415 86 951 88 527 92 610 (3.8)Compensation of employees 50 735 52 313 60 426 61 421 61 421 62 142 64 774 67 645 70 669 4.2Goods and services 17 954 22 749 22 335 25 304 25 302 28 273 22 177 20 882 21 941 (21.6)Interest on rent and land - - - - - - - - -Transfers and subsidies - - - - - - - - -Payments for capital assets 5 223 7 420 4 722 4 516 13 194 10 954 0 - - (100.0)Payments for financial assets - - - - - - - - -Total expenses 73 912 82 482 87 483 91 241 99 917 101 369 86 951 88 527 92 610 (14.2)Surplus / (Deficit) 2 645 2 028 (1 916) - (8 596) (8 679) (0) (0) - (100.0)Adjustments for Surplus/(Deficit)Rollover - 6 459 - 9 571 - 8 596 8 679 - - - (100.0) %u2013 - - - - - - - - - - %u2013 - - - - - - - - - - %u2013 - - - - - - - - - -Surplus/(deficit) - 2 645 8 487 7 655 - - - (0) (0) -1. Surplus/ (Deficit) after adjustments should be equal to zero.Cash flow from investing activities (3 646) (3 097) (1 434) (1 434) (1 434) (1 434) 3 556 3 556 3 556 (348.0)Acquisition of Assets (5 225) (6 663) (5 537) (5 537) (5 537) (5 537) - - - (100.0)Other flows from Investing Activities 1 579 3 566 4 103 4 103 4 103 4 103 3 556 3 556 3 556 (13.3)Cash flow from financing activities (324) (304) (387) (387) (387) (387) (387) (387) (387) 0.0Net increase / (decrease) in cash and cash equivalents (3 970) (3 401) (1 821) (1 821) (1 821) (1 821) 3 169 3 169 3 169 (274.0)Balance Sheet DataCarrying Value of Assets 27 017 30 252 31 682 28 546 28 546 28 546 25 341 22 001 18 518 (11.2)Cash and Cash Equivalents 22 538 27 906 26 801 26 801 26 801 26 801 26 801 26 801 26 801 0.0Receivables and Prepayments 17 187 15 502 17 499 17 499 17 499 17 499 17 499 17 499 17 499 0.0Inventory - - - - - - - - -Total Assets 66 742 73 660 75 982 72 846 72 846 72 846 69 641 66 301 62 818 (4.4)Capital and Reserves 34 335 40 641 40 969 37 453 37 453 28 774 33 825 30 033 26 560 17.6Borrowings - - - - - - - - -Post Retirement Benefits - - - - - - - - -Trade and Other Payables 25 926 25 761 26 401 26 401 26 401 26 401 26 401 26 401 26 401 0.0Deferred Income - - - - - - - - -Provisions 6 481 7 258 8 874 8 992 8 992 8 992 9 414 9 866 9 857 4.7Funds Managed (e.g. Poverty Alleviation Fund) - - - - - - - - -Contingent Liabilities 5 900 5 900 3 900 3 900 3 900 3 900 3 900 3 900 3 900 0.0Medium-term estimatesTable B.7.3: Financial summary for the Eastern Cape Parks and Tourism Agency 2021/22 2022/23 2023/24 2024/25 2025/26 2026/27 2027/28 % change from 2024/25R thousand Audited outcome Actual outcome Main budget (Approved)Adjusted budget (Approved)Revised estimateRevenueTax revenue - - - - - - - - -Non-tax revenue 381 806 321 635 310 478 298 510 281 951 281 951 305 601 273 446 265 754 8.4Sale of goods and services other than capital assets 16 810 27 441 20 000 17 245 15 190 15 190 22 087 22 638 24 530 45.4Entity revenue other than sales 5 611 6 888 7 375 5 398 5 321 5 321 1 610 1 707 1 809 (69.7)Transfers received 359 385 287 306 283 103 275 867 261 440 261 440 281 904 249 101 239 415 7.8Sale of capital assets - - - - - - - - -Financial transactions in assets and liabilities - - - - - - - - -Other non-tax revenue - - - - - - - - -Total revenue before deposits into the PRF 381 806 321 635 310 478 298 510 281 951 281 951 305 601 273 446 265 754 8.4Less Deposits into the Provincial Revenue Fund - - - - - - - - -Total revenue 381 806 321 635 310 478 298 510 281 951 281 951 305 601 273 446 265 754 8.4ExpensesCurrent expense 269 678 285 515 304 855 276 902 320 797 320 797 282 446 251 387 246 579 (12.0)Compensation of employees 169 238 175 361 191 144 201 203 204 839 204 839 195 664 208 160 222 158 (4.5)Goods and services 100 440 110 154 113 711 75 699 115 958 115 958 86 782 43 227 24 421 (25.2)Interest on rent and land - - - - - - - - -Transfers and subsidies - - - - - - - - -Payments for capital assets 85 319 13 936 29 247 21 608 36 978 36 978 23 155 22 059 19 175 (37.4)Payments for financial assets - - - - - - - - -Total expenses 354 997 299 451 334 102 298 510 357 775 357 775 305 601 273 446 265 754 (14.6)Surplus / (Deficit) 26 809 22 184 (23 624) 0 (75 824) (75 824) - - - (100.0)Adjustments for Surplus/(Deficit)Adjustments for - - - - - - - - - -Rollover & Sur - 13 408 - 116 775 - 75 824 75 824 - - - (100.0) %u2013 - - - - - - - - - - %u2013 - - - - - - - - - -Surplus/(deficit) - 26 809 35 592 93 151 0 - - - - -1. Surplus/ (Deficit) after adjustments should be equal to zero.Cash flow from investing activities (106850) (50415) (56386) (60370) (60370) (60370) (14790) (16635) (18194) (75.5)Acquisition of Assets (106 850) (49 951) (29 247) (29 247) (29 247) (29 247) (14 790) (16 635) (18 194) (49.4)Land - - - - - - - - -Proceeds from sale of property, plant and equipment - 1 262 - - - - - - -Deferred Income - - - - - - - - -Balance Sheet DataCarrying Value of Assets 399 767 416 808 358 963 616 081 616 081 616 081 630 871 632 716 634 275 2.4Land - - - - - - - - -Bank 101 381 113 671 55 299 55 299 55 299 55 299 55 299 55 299 55 299 0.0Trade Receivables 5 148 11 589 29 493 29 493 29 493 29 493 29 493 29 493 29 493 0.0Trade - - - - - - - - -Capital and Reserves 423 769 419 144 373 336 396 960 321 136 321 136 396 960 396 960 396 960 23.6Share Capital and Premium - - - - - - - - - Accumulated Reserves 396 960 396 960 396 960 396 960 396 960 396 960 396 960 396 960 396 960 0.0Current - - - - - - - - -Unrecognised transitional liabilities - - - - - - - - -Accrued Interest - - - - - - - - -Leave pay provision 12 001 12 001 12 396 14 124 14 124 14 124 14 124 14 124 14 124 0.0Other 7 131 151 206 151 151 151 151 151 151 0.0Regional Development Fund - - - - - - - - -Khayalethu Geelbooi 500 500 500 500 500 500 500 500 500 0.0Medium-term estimates 646
