
Page 669 - Demo
P. 669
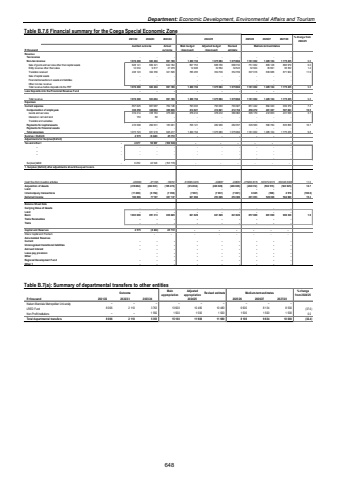
Department: Economic Development, Environmental Affairs and TourismTable B.7.6 Financial summary for the Coega Special Economic Zone 2021/22 2022/23 2023/24 2024/25 2025/26 2026/27 2027/28 % change from 2024/25R thousand Audited outcome Actual outcomeMain budget (Approved)Adjusted budget (Approved)Revised estimateRevenueTax revenue - - - - - - - - -Non-tax revenue 1 078 298 923 494 991 189 1 499 154 1 075 963 1 075 984 1 181 002 1 485 104 1 775 235 9.8Sale of goods and services other than capital assets 628 141 609 321 642 184 697 753 688 700 688 732 751 062 809 128 866 979 9.0Entity revenue other than sales 12 034 9 817 27 479 14 946 32 554 32 543 32 924 35 991 36 352 1.2Transfers received 438 123 304 356 321 526 786 455 354 709 354 709 397 016 639 986 871 904 11.9Sale of capital assets - - - - - - - - -Financial transactions in assets and liabilities - - - - - - - - -Other non-tax revenue - - - - - - - - -Total revenue before deposits into the PRF 1 078 298 923 494 991 189 1 499 154 1 075 963 1 075 984 1 181 002 1 485 104 1 775 235 9.8Less Deposits into the Provincial Revenue Fund - - - - - - - - -Total revenue 1 078 298 923 494 991 189 1 499 154 1 075 963 1 075 984 1 181 002 1 485 104 1 775 235 9.8ExpensesCurrent expense 657 625 667 287 762 126 793 033 793 033 793 627 851 442 894 320 939 379 7.3Compensation of employees 338 258 349 064 386 636 414 621 414 621 412 734 456 272 481 367 507 843 10.5Goods and services 319 214 318 163 375 490 378 412 378 412 380 893 395 170 412 953 431 536 3.7Interest on rent and land 153 60 - - - - - - -Transfers and subsidies - - - - - - - - -Payments for capital assets 416 098 264 631 183 291 706 121 282 930 282 357 329 560 590 784 835 856 16.7Payments for financial assets - - - - - - - - -Total expenses 1 073 723 931 918 945 417 1 499 154 1 075 963 1 075 984 1 181 002 1 485 104 1 775 235 9.8Surplus / (Deficit) 4 575 (8 424) 45 772 - - - - - -Adjustments for Surplus/(Deficit)Tax and other I 4 67 - 50 967 7 (199 548) - - - - - - %u2013 - - - - - - - - - - %u2013 - - - - - - - - - - %u2013 - - - - - - - - - - - - - -Surplus/(deficit 9 25 - 42 543 2 (153 776) - - - - - - 1. Surplus/ (Deficit) after adjustments should be equal to zero.Cash flow from investing activities -429999 -271395 -166741 -616095.0435 -248087 -248087 -275466.8315 -503072.9372 -539346.6338 11.0Acquisition of Assets (418 884) (264 631) (165 470) (614 034) (246 026) (246 026) (282 312) (504 573) (543 925) 14.7Land - - - - - - - - -Intercompany transactions (11 490) (6 764) (7 358) (7 061) (7 061) (7 061) 6 845 (500) 2 578 (196.9)Deferred Income 186 866 77 197 307 137 621 966 253 026 253 026 291 653 526 398 564 680 15.3Balance Sheet DataCarrying Value of Assets - - - - - - - - -Land - - - - - - - - -Bank 1 003 606 851 313 836 829 841 829 841 829 841 829 857 889 881 099 906 330 1.9Trade Receivables - - - - - - - - -Trade - - - - - - - - -Capital and Reserves 4 575 (8 424) 45 772 - - - - - - Share Capital and Premium - - - - - - - - Accumulated ReservesCurrent - - - - - - - - -Unrecognised transitional liabilities - - - - - - - - -Accrued Interest - - - - - - - - -Leave pay provision - - - - - - - -Other - - - - - - - -Regional Development Fund - - - - - - - - -Other 1 - - - - - - - - -Medium-term estimates Table B.7(a): Summary of departmental transfers to other entities Outcome Main appropriationAdjusted appropriation Revised estimate Medium-term estimates % change from 2024/25R thousand 2021/22 2022/23 2023/24 2025/26 2026/27 2027/28Nelson Mandela Metropolitan University %u2013 %u2013 %u2013 %u2013 %u2013 %u2013 %u2013 %u2013 %u2013 LRED Fund 2 110 8 006 3 763 13 600 10 480 10 480 6 600 8 134 8 500 (37.0)Non Profit Institutions %u2013 %u2013 1 592 1 500 1 500 1 500 1 500 1 500 1 500 0.0Total departmental transfers 8 006 2 110 5 355 15 100 11 980 11 980 8 100 9 634 10 000 (32.4)2024/25 648
