
Page 693 - Demo
P. 693
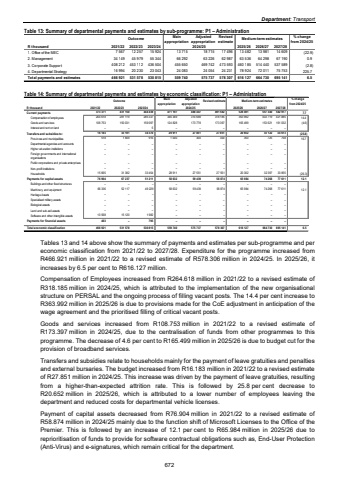
Department: Transport Table 13: Summary of departmental payments and estimates by sub-programme: P1 %u2013 Administration Outcome Main appropriationAdjusted appropriationRevised estimate Medium-term estimates % change from 2024/25R thousand 2021/22 2022/23 2023/24 2025/26 2026/27 2027/281. Office of the MEC 12 257 7 567 15 924 13 715 18 715 17 496 13 482 13 981 14 609 (22.9)2. Management 45 979 34 149 55 344 66 292 62 987 63 226 63 536 64 298 67 190 0.93. Corporate Support 408 212 453 112 436 504 455 650 473 593 469 742 460 185 514 440 537 589 (2.8)4. Departmental Strategy 20 230 16 994 23 043 24 083 24 231 24 054 78 924 72 011 75 753 225.7Total payments and estimates 466 921 531 578 530 815 559 740 578 307 575 737 616 127 664 730 695 141 6.52024/25 Table 14: Summary of departmental payments and estimates by economic classification: P1 %u2013 Administration Outcome Main appropriationAdjusted appropriation Revised estimate Medium-term estimates % change from 2024/25R thousand 2021/22 2022/23 2023/24 2025/26 2026/27 2027/28Current payments 431 150 373 371 444 439 471 197 488 447 491 582 529 491 557 340 582 917 7.7Compensation of employees 281 119 264 618 285 337 346 369 314 669 318 185 363 992 403 719 421 885 14.4Goods and services 150 031 108 753 159 097 124 828 173 778 173 397 165 499 153 621 161 032 (4.6)Interest and rent on land %u2013 %u2013 5 %u2013 %u2013 %u2013 %u2013 %u2013 %u2013 Transfers and subsidies to: 33 191 16 183 34 370 29 911 27 851 27 851 20 652 33 122 34 613 (25.8)Provinces and municipalities 1 809 518 916 1 000 300 300 350 725 758 16.7Departmental agencies and accounts %u2013 %u2013 %u2013 %u2013 %u2013 %u2013 %u2013 %u2013 %u2013 Higher education institutions %u2013 %u2013 %u2013 %u2013 %u2013 %u2013 %u2013 %u2013 %u2013 Foreign governments and international organisations %u2013 %u2013 %u2013 %u2013 %u2013 %u2013 %u2013 %u2013 %u2013Public corporations and private enterprises %u2013 %u2013 %u2013 %u2013 %u2013 %u2013 %u2013 %u2013 %u2013Non-profit institutions %u2013 %u2013 %u2013 %u2013 %u2013 %u2013 %u2013 %u2013 %u2013Households 15 665 31 382 33 454 28 911 27 551 27 551 20 302 33 855 32 397 (26.3)Payments for capital assets 76 904 67 237 51 211 58 632 59 439 58 874 65 984 77 611 74 268 12.1Buildings and other fixed structures %u2013 %u2013 %u2013 %u2013 %u2013 %u2013 %u2013 %u2013 %u2013Machinery and equipment 66 336 52 117 49 229 58 632 59 439 58 874 65 984 77 611 74 268 12.1Heritage Assets %u2013 %u2013 %u2013 %u2013 %u2013 %u2013 %u2013 %u2013 %u2013Specialised military assets %u2013 %u2013 %u2013 %u2013 %u2013 %u2013 %u2013 %u2013 %u2013Biological assets %u2013 %u2013 %u2013 %u2013 %u2013 %u2013 %u2013 %u2013 %u2013Land and sub-soil assets %u2013 %u2013 %u2013 %u2013 %u2013 %u2013 %u2013 %u2013 %u2013Software and other intangible assets 10 568 15 120 1 982 %u2013 %u2013 %u2013 %u2013 %u2013 %u2013Payments for financial assets 463 %u2013 795 %u2013 %u2013 %u2013 %u2013 %u2013 %u2013Total economic classification 466 921 531 578 530 815 559 740 575 737 578 307 616 127 695 141 664 730 6.52024/25Tables 13 and 14 above show the summary of payments and estimates per sub-programme and per economic classification from 2021/22 to 2027/28. Expenditure for the programme increased from R466.921 million in 2021/22 to a revised estimate of R578.306 million in 2024/25. In 2025/26, it increases by 6.5 per cent to R616.127 million. Compensation of Employees increased from R264.618 million in 2021/22 to a revised estimate of R318.185 million in 2024/25, which is attributed to the implementation of the new organisational structure on PERSAL and the ongoing process of filling vacant posts. The 14.4 per cent increase to R363.992 million in 2025/26 is due to provisions made for the CoE adjustment in anticipation of the wage agreement and the prioritised filling of critical vacant posts. Goods and services increased from R108.753 million in 2021/22 to a revised estimate of R173.397 million in 2024/25, due to the centralisation of funds from other programmes to this programme. The decrease of 4.6 per cent to R165.499 million in 2025/26 is due to budget cut for the provision of broadband services. Transfers and subsidies relate to households mainly for the payment of leave gratuities and penalties and external bursaries. The budget increased from R16.183 million in 2021/22 to a revised estimate of R27.851 million in 2024/25. This increase was driven by the payment of leave gratuities, resulting from a higher-than-expected attrition rate. This is followed by 25.8 per cent decrease to R20.652 million in 2025/26, which is attributed to a lower number of employees leaving the department and reduced costs for departmental vehicle licenses. Payment of capital assets decreased from R76.904 million in 2021/22 to a revised estimate of R58.874 million in 2024/25 mainly due to the function shift of Microsoft Licenses to the Office of the Premier. This is followed by an increase of 12.1 per cent to R65.984 million in 2025/26 due to reprioritisation of funds to provide for software contractual obligations such as, End-User Protection (Anti-Virus) and e-signatures, which remain critical for the department. 672
