
Page 696 - Demo
P. 696
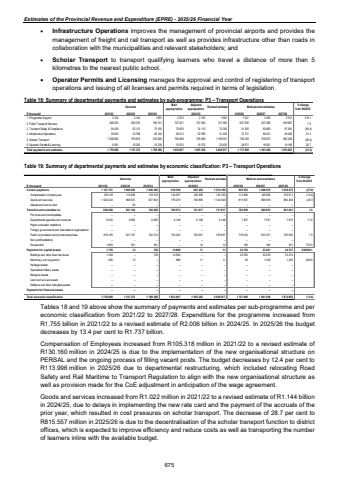
Estimates of the Provincial Revenue and Expenditure (EPRE) - 2025/26 Financial Year%uf0b7 Infrastructure Operations improves the management of provincial airports and provides the management of freight and rail transport as well as provides infrastructure other than roads in collaboration with the municipalities and relevant stakeholders; and %uf0b7 Scholar Transport to transport qualifying learners who travel a distance of more than 5 kilometres to the nearest public school. %uf0b7 Operator Permits and Licensing manages the approval and control of registering of transport operations and issuing of all licenses and permits required in terms of legislation. Table 18: Summary of departmental payments and estimates by sub-programme: P3 %u2013 Transport Operations Outcome Main appropriationAdjusted appropriation Revised estimate Medium-term estimates % change from 2024/25R thousand 2021/22 2022/23 2023/24 2025/26 2026/27 2027/281. Programme Support 2 145 2 104 1 681 2 233 2 163 1 801 7 547 2 406 2 513 319.12. Public Transport Services 659 378 646 453 764 151 727 301 747 835 747 903 807 255 837 369 819 087 7.93. Transport Safety & Compliance 62 121 54 439 70 192 75 829 74 113 75 392 31 355 83 809 87 581 (58.4)4. Infrastructure Operations 33 788 39 403 40 144 59 513 52 959 51 455 72 721 80 431 84 048 41.35. Scholar Transport 979 618 1 006 825 910 080 756 488 758 840 1 109 031 794 359 878 673 862 248 (28.4)6. Operator Permits & Licencing 10 322 6 581 10 338 12 533 19 372 20 435 24 671 18 361 19 186 20.7Total payments and estimates 1 747 372 1 755 806 1 796 586 1 633 897 1 655 282 2 006 017 1 737 908 1 901 049 1 874 663 (13.4)2024/25Table 19: Summary of departmental payments and estimates by economic classification: P3 %u2013 Transport Operations Outcome Main appropriationAdjusted appropriation Revised estimate Medium-term estimates % change from 2024/25R thousand 2021/22 2022/23 2023/24 2025/26 2026/27 2027/28Current payments 1 096 236 1 127 761 1 046 362 910 336 923 454 1 274 189 929 553 1 046 935 1 038 079 (27.0)Compensation of employees 115 528 105 318 118 519 134 057 129 558 130 160 113 996 146 996 153 611 (12.4)Goods and services 980 672 1 022 443 927 843 776 279 793 896 1 144 029 815 557 899 939 884 468 (28.7)Interest and rent on land 36 %u2013 %u2013 %u2013 %u2013 %u2013 %u2013 %u2013 %u2013 Transfers and subsidies to: 626 290 651 124 749 495 708 573 731 817 731 817 785 650 820 853 801 827 7.4Provinces and municipalities %u2013 %u2013 %u2013 %u2013 %u2013 %u2013 %u2013 %u2013 %u2013Departmental agencies and accounts 8 322 9 056 6 800 6 148 6 148 6 148 7 207 7 537 7 876 17.2Higher education institutions %u2013 %u2013 %u2013 %u2013 %u2013 %u2013 %u2013 %u2013 %u2013Foreign governments and international organisations %u2013 %u2013 %u2013 %u2013 %u2013 %u2013 %u2013 %u2013 %u2013Public corporations and private enterprises 616 165 641 737 742 314 702 425 725 657 725 657 778 343 812 971 793 590 7.3Non-profit institutions %u2013 %u2013 %u2013 %u2013 %u2013 %u2013 %u2013 %u2013 %u2013Households 1 803 331 381 %u2013 12 12 100 345 361 733.3Payments for capital assets 1 755 12 729 14 988 11 11 22 705 33 261 34 757 206309.1Buildings and other fixed structures 1 349 %u2013 729 14 000 %u2013 22 650 %u2013 32 033 33 474Machinery and equipment 406 12 %u2013 988 11 11 55 1 228 1 283 400.0Heritage Assets %u2013 %u2013 %u2013 %u2013 %u2013 %u2013 %u2013 %u2013 %u2013Specialised military assets %u2013 %u2013 %u2013 %u2013 %u2013 %u2013 %u2013 %u2013 %u2013Biological assets %u2013 %u2013 %u2013 %u2013 %u2013 %u2013 %u2013 %u2013 %u2013Land and sub-soil assets %u2013 %u2013 %u2013 %u2013 %u2013 %u2013 %u2013 %u2013 %u2013Software and other intangible assets %u2013 %u2013 %u2013 %u2013 %u2013 %u2013 %u2013 %u2013 %u2013Payments for financial assets %u2013 %u2013 %u2013 %u2013 %u2013 %u2013 %u2013 %u2013 %u2013Total economic classification 1 755 806 1 747 372 1 796 586 1 633 897 1 655 282 2 006 017 1 737 908 1 901 049 1 874 663 (13.4)2024/25Tables 18 and 19 above show the summary of payments and estimates per sub-programme and per economic classification from 2021/22 to 2027/28. Expenditure for the programme increased from R1.755 billion in 2021/22 to a revised estimate of R2.006 billion in 2024/25. In 2025/26 the budget decreases by 13.4 per cent to R1.737 billion. Compensation of Employees increased from R105.318 million in 2021/22 to a revised estimate of R130.160 million in 2024/25 is due to the implementation of the new organisational structure on PERSAL and the ongoing process of filling vacant posts. The budget decreases by 12.4 per cent to R113.996 million in 2025/26 due to departmental restructuring, which included relocating Road Safety and Rail Maritime to Transport Regulation to align with the new organisational structure as well as provision made for the CoE adjustment in anticipation of the wage agreement. Goods and services increased from R1.022 million in 2021/22 to a revised estimate of R1.144 billion in 2024/25, due to delays in implementing the new rate card and the payment of the accruals of the prior year, which resulted in cost pressures on scholar transport. The decrease of 28.7 per cent to R815.557 million in 2025/26 is due to the decentralisation of the scholar transport function to district offices, which is expected to improve efficiency and reduce costs as well as transporting the number of learners inline with the available budget. 675
