
Page 694 - Demo
P. 694
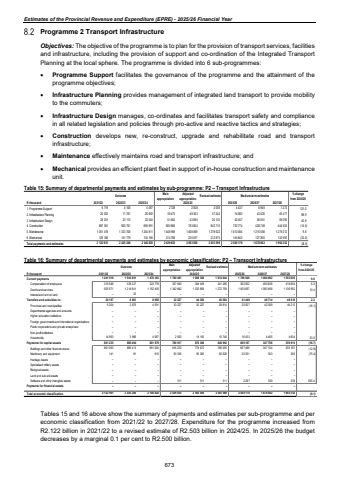
Estimates of the Provincial Revenue and Expenditure (EPRE) - 2025/26 Financial YearProgramme 2 Transport Infrastructure Objectives: The objective of the programme is to plan for the provision of transport services, facilities and infrastructure, including the provision of support and co-ordination of the Integrated Transport Planning at the local sphere. The programme is divided into 6 sub-programmes: %uf0b7 Programme Support facilitates the governance of the programme and the attainment of the programme objectives; %uf0b7 Infrastructure Planning provides management of integrated land transport to provide mobility to the commuters; %uf0b7 Infrastructure Design manages, co-ordinates and facilitates transport safety and compliance in all related legislation and policies through pro-active and reactive tactics and strategies; %uf0b7 Construction develops new, re-construct, upgrade and rehabilitate road and transport infrastructure; %uf0b7 Maintenance effectively maintains road and transport infrastructure; and %uf0b7 Mechanical provides an efficient plant fleet in support of in-house construction and maintenance unit. Table 15: Summary of departmental payments and estimates by sub-programme: P2 %u2013 Transport Infrastructure Outcome Main appropriationAdjusted appropriation Revised estimate Medium-term estimates % change from 2024/25R thousand 2021/22 2022/23 2023/24 2025/26 2026/27 2027/281. Programme Support 4 106 6 719 4 087 2 728 2 508 2 008 4 437 6 958 7 272 121.02. Infrastracture Planning 11 781 20 022 25 692 39 473 49 363 37 242 74 082 43 520 45 477 98.93. Infrastructure Design 23 113 28 251 32 044 51 842 43 695 30 133 42 457 56 551 59 095 40.94. Construction 920 761 887 361 695 991 683 865 783 604 842 710 720 774 428 749 444 503 (14.5)5. Maintanance 1 333 706 1 051 418 1 254 811 1 446 959 1 468 069 1 378 622 1 513 584 1 215 558 1 275 012 9.86. Mechanical 141 779 129 180 134 195 214 768 235 817 212 875 144 842 127 266 132 993 (32.0)Total payments and estimates 2 435 246 2 122 951 2 146 820 2 439 635 2 583 056 2 503 590 2 500 176 1 878 602 1 964 352 (0.1)2024/25Table 16: Summary of departmental payments and estimates by economic classification: P2 %u2013 Transport Infrastructure Outcome Main appropriationAdjusted appropriation Revised estimate Medium-term estimates % change from 2024/25R thousand 2021/22 2022/23 2023/24 2025/26 2026/27 2027/28Current payments 1 543 091 1 241 519 1 476 183 1 700 491 1 668 308 1 614 044 1 768 629 1 484 092 1 555 626 9.6Compensation of employees 328 227 315 948 323 778 357 649 344 449 341 285 362 932 400 636 418 664 6.3Goods and services 1 214 841 925 571 1 152 405 1 342 842 1 323 859 1 272 759 1 405 697 1 083 456 1 136 962 10.4Interest and rent on land 23 %u2013 %u2013 %u2013 %u2013 %u2013 %u2013 %u2013 %u2013 Transfers and subsidies to: 6 661 20 197 8 658 32 227 44 382 40 554 41 440 46 714 48 816 2.2Provinces and municipalities 2 675 5 204 4 591 30 227 30 227 29 814 25 007 42 309 44 212 (16.1)Departmental agencies and accounts %u2013 %u2013 %u2013 %u2013 %u2013 %u2013 %u2013 %u2013 %u2013 Higher education institutions %u2013 %u2013 %u2013 %u2013 %u2013 %u2013 %u2013 %u2013 %u2013Foreign governments and international organisations %u2013 %u2013 %u2013 %u2013 %u2013 %u2013 %u2013 %u2013 %u2013Public corporations and private enterprises %u2013 %u2013 %u2013 %u2013 %u2013 %u2013 %u2013 %u2013 %u2013Non-profit institutions %u2013 %u2013 %u2013 %u2013 %u2013 %u2013 %u2013 %u2013 %u2013Households 14 993 3 986 4 067 2 000 14 155 10 740 16 433 4 405 4 604 53.0Payments for capital assets 861 235 885 494 661 979 706 917 870 366 848 992 690 107 347 796 359 910 (18.7)Buildings and other fixed structures 861 093 885 413 661 064 616 270 774 672 766 055 667 469 347 104 359 187 (12.9)Machinery and equipment 141 81 915 90 336 95 383 82 626 20 351 353 369 (75.4)Heritage Assets %u2013 %u2013 %u2013 %u2013 %u2013 %u2013 %u2013 %u2013 %u2013Specialised military assets %u2013 %u2013 %u2013 %u2013 %u2013 %u2013 %u2013 %u2013 %u2013Biological assets %u2013 %u2013 %u2013 %u2013 %u2013 %u2013 %u2013 %u2013 %u2013Land and sub-soil assets %u2013 %u2013 %u2013 %u2013 %u2013 %u2013 %u2013 %u2013 %u2013Software and other intangible assets %u2013 %u2013 %u2013 311 311 311 2 287 339 354 635.4Payments for financial assets %u2013 %u2013 %u2013 %u2013 %u2013 %u2013 %u2013 %u2013 %u2013Total economic classification 2 122 951 2 435 246 2 146 820 2 439 635 2 583 056 2 503 590 2 500 176 1 878 602 1 964 352 (0.1)2024/25Tables 15 and 16 above show the summary of payments and estimates per sub-programme and per economic classification from 2021/22 to 2027/28. Expenditure for the programme increased from R2.122 billion in 2021/22 to a revised estimate of R2.503 billion in 2024/25. In 2025/26 the budget decreases by a marginal 0.1 per cent to R2.500 billion. 673
