
Page 698 - Demo
P. 698
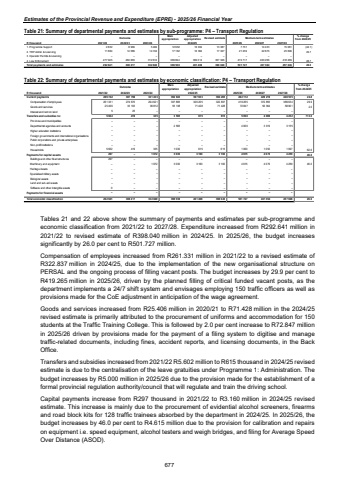
Estimates of the Provincial Revenue and Expenditure (EPRE) - 2025/26 Financial YearTable 21: Summary of departmental payments and estimates by sub-programme: P4 %u2013 Transport RegulationOutcome Main appropriationAdjusted appropriation Revised estimate Medium-term estimates % change from 2024/25R thousand 2021/22 2022/23 2023/24 2025/26 2026/27 2027/281. Programme Support 2 832 8 966 5 484 12 652 16 032 13 387 7 751 14 433 15 081 (42.1)2. TRP Admin & Licencing 11 864 14 586 14 744 17 162 16 362 17 327 21 259 22 675 23 696 22.73. Operator Permits & Licencing %u2013 %u2013 %u2013 %u2013 %u2013 %u2013 %u2013 %u2013 %u20134. Law Enforcement 277 945 284 665 312 612 369 694 369 014 367 326 472 717 400 256 418 269 28.7Total payments and estimates 292 641 308 217 332 840 399 508 401 408 398 040 501 727 437 364 457 046 26.02024/25Table 22: Summary of departmental payments and estimates by economic classification: P4 %u2013 Transport Regulation Outcome Main appropriationAdjusted appropriation Revised estimate Medium-term estimates % change from 2024/25R thousand 2021/22 2022/23 2023/24 2025/26 2026/27 2027/28Current payments 286 742 307 798 331 433 392 943 397 633 394 265 492 112 429 219 448 535 24.8Compensation of employees 261 331 274 670 294 621 337 805 326 205 322 837 419 265 372 855 389 634 29.9Goods and services 25 406 33 103 36 812 55 138 71 428 71 428 72 847 56 364 58 901 2.0Interest and rent on land 5 25 %u2013 %u2013 %u2013 %u2013 %u2013 %u2013 %u2013Transfers and subsidies to: 5 602 419 335 3 565 615 615 5 000 4 069 4 252 713.0Provinces and municipalities %u2013 %u2013 %u2013 %u2013 %u2013 %u2013 %u2013 %u2013 %u2013Departmental agencies and accounts %u2013 %u2013 %u2013 2 565 %u2013 %u2013 4 000 3 019 3 155Higher education institutions %u2013 %u2013 %u2013 %u2013 %u2013 %u2013 %u2013 %u2013 %u2013Foreign governments and international organisations %u2013 %u2013 %u2013 %u2013 %u2013 %u2013 %u2013 %u2013 %u2013Public corporations and private enterprises %u2013 %u2013 %u2013 %u2013 %u2013 %u2013 %u2013 %u2013 %u2013Non-profit institutions %u2013 %u2013 %u2013 %u2013 %u2013 %u2013 %u2013 %u2013 %u2013Households 5 602 419 335 1 000 615 615 1 000 1 050 1 097 62.6Payments for capital assets 297 %u2013 1 072 3 000 3 160 3 160 4 615 4 076 4 259 46.0Buildings and other fixed structures 297 %u2013 %u2013 %u2013 %u2013 %u2013 %u2013 %u2013 %u2013Machinery and equipment %u2013 %u2013 1 072 3 000 3 160 3 160 4 615 4 076 4 259 46.0Heritage Assets %u2013 %u2013 %u2013 %u2013 %u2013 %u2013 %u2013 %u2013 %u2013Specialised military assets %u2013 %u2013 %u2013 %u2013 %u2013 %u2013 %u2013 %u2013 %u2013Biological assets %u2013 %u2013 %u2013 %u2013 %u2013 %u2013 %u2013 %u2013 %u2013Land and sub-soil assets %u2013 %u2013 %u2013 %u2013 %u2013 %u2013 %u2013 %u2013 %u2013Software and other intangible assets 0 %u2013 %u2013 %u2013 %u2013 %u2013 %u2013 %u2013 %u2013Payments for financial assets %u2013 %u2013 %u2013 %u2013 %u2013 %u2013 %u2013 %u2013 %u2013Total economic classification 292 641 308 217 332 840 399 508 401 408 398 040 501 727 437 364 457 046 26.02024/25Tables 21 and 22 above show the summary of payments and estimates per sub-programme and economic classification from 2021/22 to 2027/28. Expenditure increased from R292.641 million in 2021/22 to revised estimate of R398.040 million in 2024/25. In 2025/26, the budget increases significantly by 26.0 per cent to R501.727 million. Compensation of employees increased from R261.331 million in 2021/22 to a revised estimate of R322.837 million in 2024/25, due to the implementation of the new organisational structure on PERSAL and the ongoing process of filling vacant posts. The budget increases by 29.9 per cent to R419.265 million in 2025/26, driven by the planned filling of critical funded vacant posts, as the department implements a 24/7 shift system and envisages employing 150 traffic officers as well as provisions made for the CoE adjustment in anticipation of the wage agreement. Goods and services increased from R25.406 million in 2020/21 to R71.428 million in the 2024/25 revised estimate is primarily attributed to the procurement of uniforms and accommodation for 150 students at the Traffic Training College. This is followed by 2.0 per cent increase to R72.847 million in 2025/26 driven by provisions made for the payment of a filing system to digitise and manage traffic-related documents, including fines, accident reports, and licensing documents, in the Back Office. Transfers and subsidies increased from 2021/22 R5.602 million to R615 thousand in 2024/25 revised estimate is due to the centralisation of the leave gratuities under Programme 1: Administration. The budget increases by R5.000 million in 2025/26 due to the provision made for the establishment of a formal provincial regulation authority/council that will regulate and train the driving school. Capital payments increase from R297 thousand in 2021/22 to R3.160 million in 2024/25 revised estimate. This increase is mainly due to the procurement of evidential alcohol screeners, firearms and road block kits for 128 traffic trainees absorbed by the department in 2024/25. In 2025/26, the budget increases by 46.0 per cent to R4.615 million due to the provision for calibration and repairs on equipment i.e. speed equipment, alcohol testers and weigh bridges, and filing for Average Speed Over Distance (ASOD). 677
