
Page 708 - Demo
P. 708
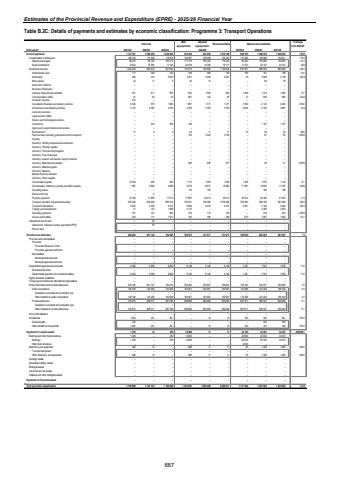
Estimates of the Provincial Revenue and Expenditure (EPRE) - 2025/26 Financial YearTable B.2C: Details of payments and estimates by economic classification: Programme 3: Transport Operations Outcome Main appropriationAdjusted appropriation Revised estimate Medium-term estimates % change from 2024/25R thousand 2021/22 2022/23 2023/24 2025/26 2026/27 2027/28Current payments 1 096 236 1 127 761 1 046 362 910 336 923 454 1 274 189 929 553 1 046 935 1 038 079 (27.0)Compensation of employees 105 318 115 528 118 519 134 057 129 558 130 160 113 996 146 996 153 611 (12.4)Salaries and wages 90 676 99 163 100 774 111 779 109 792 110 443 96 022 123 889 129 464 (13.1)Social contributions 14 643 16 365 17 745 22 278 19 766 19 717 17 974 23 107 24 147 (8.8)Goods and services 1 022 443 980 672 927 843 776 279 793 896 1 144 029 815 557 899 939 884 468 (28.7)Administrative fees 326 117 120 198 385 136 160 161 168 17.6Advertising 415 466 5 033 4 237 4 228 4 207 30 3 929 4 106 (99.3)Minor assets 17 23 6 40 10 %u2013 %u2013 89 93 Audit costs: External %u2013 %u2013 %u2013 %u2013 %u2013 %u2013 %u2013 %u2013 %u2013Bursaries: Employees %u2013 %u2013 %u2013 %u2013 %u2013 %u2013 %u2013 %u2013 %u2013Catering: Departmental activities 341 611 875 852 1 002 992 1 058 1 374 1 436 6.7Communication (G&S) 41 46 43 867 122 95 72 842 880 (24.2)Computer services 415 %u2013 %u2013 %u2013 %u2013 %u2013 %u2013 %u2013 %u2013Consultants: Business and advisory services 5 322 910 1 965 1 687 1 371 1 371 7 000 2 144 2 240 410.6Infrastructure and planning services 3 153 4 300 3 702 4 700 4 700 3 709 3 696 3 720 3 887 (0.4)Laboratory services %u2013 %u2013 %u2013 %u2013 %u2013 %u2013 %u2013 %u2013 %u2013Legal services (G&S) %u2013 %u2013 %u2013 %u2013 %u2013 %u2013 %u2013 %u2013 %u2013Science and technological services %u2013 %u2013 %u2013 %u2013 %u2013 %u2013 %u2013 %u2013 %u2013Contractors %u2013 510 568 166 %u2013 %u2013 %u2013 1 107 1 157Agency and support/outsourced services %u2013 %u2013 %u2013 %u2013 %u2013 %u2013 %u2013 %u2013 %u2013Entertainment 17 8 2 20 11 11 18 20 20 63.6Fleet services (including government motor transport) %u2013 %u2013 %u2013 104 3 444 3 162 %u2013 81 85 (100.0)Housing %u2013 %u2013 %u2013 %u2013 %u2013 %u2013 %u2013 %u2013 %u2013Inventory: Clothing material and accessories %u2013 %u2013 %u2013 %u2013 %u2013 %u2013 %u2013 %u2013 %u2013Inventory: Farming supplies %u2013 %u2013 %u2013 %u2013 %u2013 %u2013 %u2013 %u2013 %u2013Inventory: Food and food supplies %u2013 %u2013 %u2013 %u2013 %u2013 %u2013 %u2013 %u2013 %u2013Inventory: Fuel, oil and gas %u2013 %u2013 %u2013 %u2013 %u2013 %u2013 %u2013 %u2013 %u2013Inventory: Learner and teacher support material %u2013 %u2013 %u2013 %u2013 %u2013 %u2013 %u2013 %u2013 %u2013Inventory: Materials and supplies %u2013 %u2013 %u2013 936 936 877 %u2013 30 31 (100.0)Inventory: Medical supplies %u2013 %u2013 %u2013 %u2013 %u2013 %u2013 %u2013 %u2013 %u2013Inventory: Medicine %u2013 %u2013 %u2013 %u2013 %u2013 %u2013 %u2013 %u2013 %u2013Medsas inventory interface %u2013 %u2013 %u2013 %u2013 %u2013 %u2013 %u2013 %u2013 %u2013Inventory: Other supplies %u2013 %u2013 %u2013 %u2013 %u2013 %u2013 %u2013 %u2013 %u2013Consumable supplies 14 643 200 684 1 157 1 259 1 259 1 336 1 075 1 124 6.1Consumables: Stationery, printing and office supplies 1 667 2 606 4 608 5 074 13 677 15 486 11 681 10 820 11 307 (24.6)Operating leases %u2013 %u2013 %u2013 172 150 %u2013 %u2013 180 188Rental and hiring %u2013 5 %u2013 %u2013 %u2013 %u2013 %u2013 %u2013 %u2013Property payments 14 726 11 800 17 513 17 897 23 013 23 014 22 612 20 325 21 239 (1.7)Transport provided: Departmental activity 976 456 954 009 885 143 730 431 729 366 1 079 499 763 093 845 333 827 408 (29.3)Travel and subsistence 4 022 4 478 5 212 4 694 9 319 9 273 3 831 5 196 5 429 (58.7)Training and development 31 133 1 088 2 115 %u2013 %u2013 %u2013 2 290 2 393Operating payments 751 127 264 192 115 150 %u2013 216 225 (100.0)Venues and facilities 253 171 1 017 740 788 788 970 1 007 1 052 23.1Interest and rent on land %u2013 36 %u2013 %u2013 %u2013 %u2013 %u2013 %u2013 %u2013Interest (Incl. interest on unitary payments (PPP)) %u2013 36 %u2013 %u2013 %u2013 %u2013 %u2013 %u2013 %u2013Rent on land %u2013 %u2013 %u2013 %u2013 %u2013 %u2013 %u2013 %u2013 %u2013Transfers and subsidies 626 290 651 124 749 495 708 573 731 817 731 817 785 650 820 853 801 827 7.4 Provinces and municipalities %u2013 %u2013 %u2013 %u2013 %u2013 %u2013 %u2013 %u2013 %u2013Provinces %u2013 %u2013 %u2013 %u2013 %u2013 %u2013 %u2013 %u2013 %u2013Provincial Revenue Funds %u2013 %u2013 %u2013 %u2013 %u2013 %u2013 %u2013 %u2013 %u2013Provincial agencies and funds %u2013 %u2013 %u2013 %u2013 %u2013 %u2013 %u2013 %u2013 %u2013Municipalities %u2013 %u2013 %u2013 %u2013 %u2013 %u2013 %u2013 %u2013 %u2013Municipal bank accounts %u2013 %u2013 %u2013 %u2013 %u2013 %u2013 %u2013 %u2013 %u2013Municipal agencies and funds %u2013 %u2013 %u2013 %u2013 %u2013 %u2013 %u2013 %u2013 %u2013Departmental agencies and accounts 8 322 9 056 6 800 6 148 6 148 6 148 7 207 7 537 7 876 17.2Social security funds %u2013 %u2013 %u2013 %u2013 %u2013 %u2013 %u2013 %u2013 %u2013Departmental agencies (non-business entities) 8 322 9 056 6 800 6 148 6 148 6 148 7 207 7 537 7 876 17.2Higher education institutions %u2013 %u2013 %u2013 %u2013 %u2013 %u2013 %u2013 %u2013 %u2013Foreign governments and international organisations %u2013 %u2013 %u2013 %u2013 %u2013 %u2013 %u2013 %u2013 %u2013Public corporations and private enterprises 616 165 641 737 742 314 702 425 725 657 725 657 778 343 812 971 793 590 7.3Public corporations 145 190 143 226 154 528 163 567 163 567 163 567 170 666 214 424 168 108 4.3Subsidies on products and production (pc) %u2013 %u2013 %u2013 %u2013 %u2013 %u2013 %u2013 %u2013 %u2013Other transfers to public corporations 145 190 143 226 154 528 163 567 163 567 163 567 170 666 214 424 168 108 4.3Private enterprises 470 975 498 511 587 786 538 858 562 090 562 090 607 677 598 547 625 482 8.1Subsidies on products and production (pe) %u2013 %u2013 %u2013 %u2013 %u2013 %u2013 %u2013 %u2013 %u2013Other transfers to private enterprises 470 975 498 511 587 786 538 858 562 090 562 090 607 677 598 547 625 482 8.1Non-profit institutions %u2013 %u2013 %u2013 %u2013 %u2013 %u2013 %u2013 %u2013 %u2013Households 1 803 331 381 %u2013 12 12 100 345 361 733.3Social benefits 416 %u2013 %u2013 %u2013 %u2013 %u2013 %u2013 244 255Other transfers to households 1 387 331 381 %u2013 12 12 100 101 106 733.3Payments for capital assets 1 755 12 729 14 988 11 11 22 705 33 261 34 757 206309.1Buildings and other fixed structures 1 349 %u2013 729 14 000 %u2013 %u2013 22 650 32 033 33 474Buildings 1 349 %u2013 729 14 000 %u2013 %u2013 20 000 32 033 33 474Other fixed structures %u2013 %u2013 %u2013 %u2013 %u2013 %u2013 2 650 %u2013 %u2013Machinery and equipment 406 12 %u2013 988 11 11 55 1 228 1 283 400.0Transport equipment %u2013 %u2013 %u2013 %u2013 %u2013 %u2013 %u2013 %u2013 %u2013Other machinery and equipment 406 12 %u2013 988 11 11 55 1 228 1 283 400.0Heritage Assets %u2013 %u2013 %u2013 %u2013 %u2013 %u2013 %u2013 %u2013 %u2013Specialised military assets %u2013 %u2013 %u2013 %u2013 %u2013 %u2013 %u2013 %u2013 %u2013Biological assets %u2013 %u2013 %u2013 %u2013 %u2013 %u2013 %u2013 %u2013 %u2013Land and sub-soil assets %u2013 %u2013 %u2013 %u2013 %u2013 %u2013 %u2013 %u2013 %u2013Software and other intangible assets %u2013 %u2013 %u2013 %u2013 %u2013 %u2013 %u2013 %u2013 %u2013Payments for financial assets %u2013 %u2013 %u2013 %u2013 %u2013 %u2013 %u2013 %u2013 %u2013Total economic classification 1 755 806 1 747 372 1 796 586 1 633 897 1 655 282 2 006 017 1 737 908 1 901 049 1 874 663 (13.4)2024/25687
