
Page 710 - Demo
P. 710
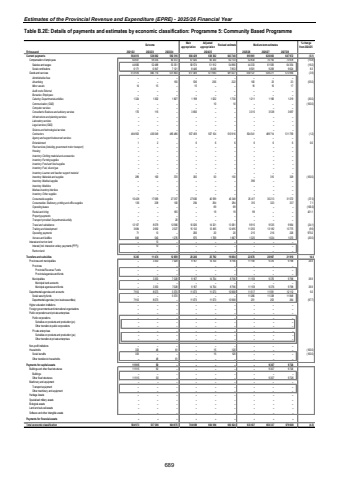
Estimates of the Provincial Revenue and Expenditure (EPRE) - 2025/26 Financial YearTable B.2E: Details of payments and estimates by economic classification: Programme 5: Community Based Programme Outcome Main appropriationAdjusted appropriation Revised estimate Medium-term estimates % change from 2024/25R thousand 2021/22 2022/23 2023/24 2025/26 2026/27 2027/28Current payments 526 062 564 813 592 316 684 429 638 302 643 740 610 961 620 063 647 972 (5.1)Compensation of employees 50 837 59 335 60 472 67 020 60 320 62 733 52 834 70 792 73 978 (15.8)Salaries and wages 44 666 52 488 53 351 58 574 51 912 54 880 44 333 61 583 64 354 (19.2)Social contributions 6 171 6 847 7 121 8 446 8 408 7 853 8 501 9 209 9 624 8.3Goods and services 513 976 466 714 531 844 617 409 577 983 581 007 558 127 549 271 573 994 (3.9)Administrative fees %u2013 %u2013 %u2013 %u2013 %u2013 %u2013 %u2013 %u2013 %u2013 Advertising %u2013 %u2013 150 536 206 222 100 23 23 (55.0)Minor assets 15 14 %u2013 15 %u2013 %u2013 16 16 17 Audit costs: External %u2013 %u2013 %u2013 %u2013 %u2013 %u2013 %u2013 %u2013 %u2013Bursaries: Employees %u2013 %u2013 %u2013 %u2013 %u2013 %u2013 %u2013 %u2013 %u2013Catering: Departmental activities 1 324 1 302 1 827 1 198 1 022 1 730 1 211 1 166 1 219 (30.0)Communication (G&S) %u2013 %u2013 %u2013 %u2013 10 10 %u2013 %u2013 %u2013 (100.0)Computer services %u2013 %u2013 %u2013 %u2013 %u2013 %u2013 %u2013 %u2013 %u2013Consultants: Business and advisory services 170 115 %u2013 3 656 %u2013 %u2013 3 315 3 538 3 697Infrastructure and planning services %u2013 %u2013 %u2013 %u2013 %u2013 %u2013 %u2013 %u2013 %u2013Laboratory services %u2013 %u2013 %u2013 %u2013 %u2013 %u2013 %u2013 %u2013 %u2013Legal services (G&S) %u2013 %u2013 %u2013 %u2013 %u2013 %u2013 %u2013 %u2013 %u2013Science and technological services %u2013 %u2013 %u2013 %u2013 %u2013 %u2013 %u2013 %u2013 %u2013Contractors 484 903 436 549 485 486 557 459 507 104 510 916 504 541 489 714 511 759 (1.2)Agency and support/outsourced services %u2013 %u2013 %u2013 %u2013 %u2013 %u2013 %u2013 %u2013 %u2013Entertainment 1 2 %u2013 6 6 6 6 6 6 0.0Fleet services (including government motor transport) %u2013 %u2013 %u2013 %u2013 %u2013 %u2013 %u2013 %u2013 %u2013Housing %u2013 %u2013 %u2013 %u2013 %u2013 %u2013 %u2013 %u2013 %u2013Inventory: Clothing material and accessories %u2013 %u2013 %u2013 %u2013 %u2013 %u2013 %u2013 %u2013 %u2013Inventory: Farming supplies %u2013 %u2013 %u2013 %u2013 %u2013 %u2013 %u2013 %u2013 %u2013Inventory: Food and food supplies %u2013 %u2013 %u2013 %u2013 %u2013 %u2013 %u2013 %u2013 %u2013Inventory: Fuel, oil and gas %u2013 %u2013 %u2013 %u2013 %u2013 %u2013 %u2013 %u2013 %u2013Inventory: Learner and teacher support material %u2013 %u2013 %u2013 %u2013 %u2013 %u2013 %u2013 %u2013 %u2013Inventory: Materials and supplies 289 100 370 300 50 150 %u2013 315 329 (100.0)Inventory: Medical supplies %u2013 %u2013 %u2013 %u2013 %u2013 %u2013 396 %u2013 %u2013Inventory: Medicine %u2013 %u2013 %u2013 %u2013 %u2013 %u2013 %u2013 %u2013 %u2013Medsas inventory interface %u2013 %u2013 %u2013 %u2013 %u2013 %u2013 %u2013 %u2013 %u2013Inventory: Other supplies %u2013 %u2013 %u2013 %u2013 %u2013 %u2013 %u2013 %u2013 %u2013Consumable supplies 10 428 17 069 27 357 27 606 40 599 40 348 25 417 30 213 31 572 (37.0)Consumables: Stationery, printing and office supplies 136 238 100 294 294 294 315 323 337 7.1Operating leases %u2013 %u2013 %u2013 %u2013 69 69 %u2013 %u2013 %u2013 (100.0)Rental and hiring %u2013 %u2013 165 %u2013 19 19 99 %u2013 %u2013 421.1Property payments %u2013 %u2013 %u2013 %u2013 %u2013 %u2013 %u2013 %u2013 %u2013Transport provided: Departmental activity %u2013 %u2013 20 %u2013 %u2013 %u2013 %u2013 %u2013 %u2013Travel and subsistence 12 107 8 079 12 566 10 026 14 321 13 061 9 915 9 535 9 964 (24.1)Training and development 3 684 2 692 2 527 15 132 12 495 12 495 11 255 13 182 13 775 (9.9)Operating payments 71 13 %u2013 206 20 20 215 216 226 975.0Venues and facilities 849 540 1 276 975 1 769 1 667 1 325 1 024 1 070 (20.5)Interest and rent on land %u2013 13 %u2013 %u2013 %u2013 %u2013 %u2013 %u2013 %u2013Interest (Incl. interest on unitary payments (PPP)) %u2013 13 %u2013 %u2013 %u2013 %u2013 %u2013 %u2013 %u2013Rent on land %u2013 %u2013 %u2013 %u2013 %u2013 %u2013 %u2013 %u2013 %u2013Transfers and subsidies 8 245 11 474 12 659 20 240 25 792 19 884 22 676 20 967 21 910 14.0 Provinces and municipalities %u2013 3 353 7 028 9 167 14 704 8 796 11 159 9 376 9 798 26.9Provinces %u2013 %u2013 %u2013 %u2013 %u2013 %u2013 %u2013 %u2013 %u2013Provincial Revenue Funds %u2013 %u2013 %u2013 %u2013 %u2013 %u2013 %u2013 %u2013 %u2013Provincial agencies and funds %u2013 %u2013 %u2013 %u2013 %u2013 %u2013 %u2013 %u2013 %u2013Municipalities %u2013 3 353 7 028 9 167 14 704 8 796 11 159 9 376 9 798 26.9Municipal bank accounts %u2013 %u2013 %u2013 %u2013 %u2013 %u2013 %u2013 %u2013 %u2013Municipal agencies and funds %u2013 3 353 7 028 9 167 14 704 8 796 11 159 9 376 9 798 26.9Departmental agencies and accounts 7 912 8 073 5 570 11 073 11 073 10 968 11 517 11 591 12 112 5.0Social security funds %u2013 %u2013 5 570 %u2013 %u2013 %u2013 11 266 11 338 11 848Departmental agencies (non-business entities) 7 912 8 073 %u2013 11 073 11 073 10 968 251 253 264 (97.7)Higher education institutions %u2013 %u2013 %u2013 %u2013 %u2013 %u2013 %u2013 %u2013 %u2013Foreign governments and international organisations %u2013 %u2013 %u2013 %u2013 %u2013 %u2013 %u2013 %u2013 %u2013Public corporations and private enterprises %u2013 %u2013 %u2013 %u2013 %u2013 %u2013 %u2013 %u2013 %u2013Public corporations %u2013 %u2013 %u2013 %u2013 %u2013 %u2013 %u2013 %u2013 %u2013Subsidies on products and production (pc) %u2013 %u2013 %u2013 %u2013 %u2013 %u2013 %u2013 %u2013 %u2013Other transfers to public corporations %u2013 %u2013 %u2013 %u2013 %u2013 %u2013 %u2013 %u2013 %u2013Private enterprises %u2013 %u2013 %u2013 %u2013 %u2013 %u2013 %u2013 %u2013 %u2013Subsidies on products and production (pe) %u2013 %u2013 %u2013 %u2013 %u2013 %u2013 %u2013 %u2013 %u2013Other transfers to private enterprises %u2013 %u2013 %u2013 %u2013 %u2013 %u2013 %u2013 %u2013 %u2013Non-profit institutions %u2013 %u2013 %u2013 %u2013 %u2013 %u2013 %u2013 %u2013 %u2013Households 333 48 61 %u2013 15 120 %u2013 %u2013 %u2013 (100.0)Social benefits 333 %u2013 %u2013 %u2013 15 120 %u2013 %u2013 %u2013 (100.0)Other transfers to households %u2013 48 61 %u2013 %u2013 %u2013 %u2013 %u2013 %u2013Payments for capital assets 11 915 50 %u2013 %u2013 %u2013 %u2013 %u2013 9 307 9 726Buildings and other fixed structures 11 915 50 %u2013 %u2013 %u2013 %u2013 %u2013 9 307 9 726Buildings %u2013 %u2013 %u2013 %u2013 %u2013 %u2013 %u2013 %u2013 %u2013Other fixed structures 11 915 50 %u2013 %u2013 %u2013 %u2013 %u2013 9 307 9 726Machinery and equipment %u2013 %u2013 %u2013 %u2013 %u2013 %u2013 %u2013 %u2013 %u2013Transport equipment %u2013 %u2013 %u2013 %u2013 %u2013 %u2013 %u2013 %u2013 %u2013Other machinery and equipment %u2013 %u2013 %u2013 %u2013 %u2013 %u2013 %u2013 %u2013 %u2013Heritage Assets %u2013 %u2013 %u2013 %u2013 %u2013 %u2013 %u2013 %u2013 %u2013Specialised military assets %u2013 %u2013 %u2013 %u2013 %u2013 %u2013 %u2013 %u2013 %u2013Biological assets %u2013 %u2013 %u2013 %u2013 %u2013 %u2013 %u2013 %u2013 %u2013Land and sub-soil assets %u2013 %u2013 %u2013 %u2013 %u2013 %u2013 %u2013 %u2013 %u2013Software and other intangible assets %u2013 %u2013 %u2013 %u2013 %u2013 %u2013 %u2013 %u2013 %u2013Payments for financial assets %u2013 %u2013 %u2013 %u2013 %u2013 %u2013 %u2013 %u2013 %u2013Total economic classification 584 973 537 586 604 975 704 669 664 094 663 624 633 637 650 337 679 608 (4.5)2024/25689
