
Page 709 - Demo
P. 709
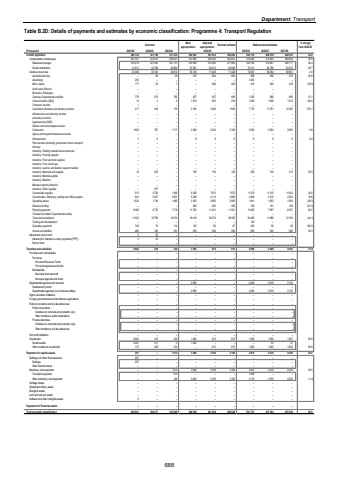
Department: Transport Table B.2D: Details of payments and estimates by economic classification: Programme 4: Transport Regulation Outcome Main appropriationAdjusted appropriation Revised estimate Medium-term estimates % change from 2024/25R thousand 2021/22 2022/23 2023/24 2025/26 2026/27 2027/28Current payments 307 798 286 742 331 433 392 943 397 633 394 265 492 112 429 219 448 535 24.8Compensation of employees 261 331 274 670 294 621 337 805 326 205 322 837 419 265 372 855 389 634 29.9Salaries and wages 219 518 231 902 247 737 279 958 275 293 271 989 343 124 312 067 326 111 26.2Social contributions 41 813 42 768 46 884 57 847 50 912 50 848 76 141 60 788 63 523 49.7Goods and services 33 103 25 406 36 812 55 138 71 428 71 428 72 847 56 364 58 901 2.0Administrative fees 69 %u2013 28 219 664 664 968 936 978 45.8Advertising %u2013 295 %u2013 %u2013 %u2013 %u2013 4 450 %u2013 %u2013 Minor assets 29 177 7 %u2013 846 594 416 400 418 (30.0)Audit costs: External %u2013 %u2013 %u2013 %u2013 %u2013 %u2013 %u2013 %u2013 %u2013Bursaries: Employees %u2013 %u2013 %u2013 %u2013 %u2013 %u2013 %u2013 %u2013 %u2013Catering: Departmental activities 776 674 795 627 627 858 1 262 669 699 47.1Communication (G&S) 12 3 9 1 519 603 418 1 020 1 026 1 072 144.0Computer services 1 %u2013 %u2013 %u2013 %u2013 %u2013 %u2013 %u2013 %u2013Consultants: Business and advisory services 417 246 179 2 160 1 640 1 640 7 776 11 791 12 322 374.1Infrastructure and planning services %u2013 %u2013 %u2013 %u2013 %u2013 %u2013 %u2013 %u2013 %u2013Laboratory services %u2013 %u2013 %u2013 %u2013 %u2013 %u2013 %u2013 %u2013 %u2013Legal services (G&S) %u2013 %u2013 %u2013 %u2013 %u2013 %u2013 %u2013 %u2013 %u2013Science and technological services %u2013 %u2013 %u2013 %u2013 %u2013 %u2013 %u2013 %u2013 %u2013Contractors 1 629 767 1 717 3 306 3 243 3 188 3 500 3 504 3 662 9.8Agency and support/outsourced services %u2013 %u2013 %u2013 %u2013 %u2013 %u2013 %u2013 %u2013 %u2013Entertainment 2 6 %u2013 8 8 8 8 8 8 0.0Fleet services (including government motor transport) %u2013 %u2013 %u2013 %u2013 %u2013 %u2013 %u2013 %u2013 %u2013Housing %u2013 %u2013 %u2013 %u2013 %u2013 %u2013 %u2013 %u2013 %u2013Inventory: Clothing material and accessories %u2013 %u2013 %u2013 %u2013 %u2013 %u2013 %u2013 %u2013 %u2013Inventory: Farming supplies %u2013 %u2013 %u2013 %u2013 %u2013 %u2013 %u2013 %u2013 %u2013Inventory: Food and food supplies %u2013 %u2013 %u2013 %u2013 %u2013 %u2013 %u2013 %u2013 %u2013Inventory: Fuel, oil and gas %u2013 %u2013 %u2013 %u2013 %u2013 %u2013 %u2013 %u2013 %u2013Inventory: Learner and teacher support material %u2013 %u2013 %u2013 %u2013 %u2013 %u2013 %u2013 %u2013 %u2013Inventory: Materials and supplies 10 233 %u2013 192 192 192 250 210 219 30.2Inventory: Medical supplies %u2013 %u2013 %u2013 %u2013 %u2013 %u2013 %u2013 %u2013 %u2013Inventory: Medicine %u2013 %u2013 %u2013 %u2013 %u2013 %u2013 %u2013 %u2013 %u2013Medsas inventory interface %u2013 %u2013 %u2013 %u2013 %u2013 %u2013 %u2013 %u2013 %u2013Inventory: Other supplies %u2013 337 %u2013 %u2013 %u2013 %u2013 %u2013 %u2013 %u2013Consumable supplies 515 5 758 1 456 8 328 7 972 7 972 11 370 11 315 11 824 42.6Consumables: Stationery, printing and office supplies 644 5 407 4 501 5 256 4 112 4 086 4 848 4 310 4 504 18.6Operating leases 1 634 1 744 1 485 2 433 2 983 2 983 1 841 1 853 1 936 (38.3)Rental and hiring %u2013 %u2013 %u2013 200 200 390 150 101 106 (61.5)Property payments 6 466 6 770 7 716 11 784 11 241 11 201 13 460 7 997 8 357 20.2Transport provided: Departmental activity %u2013 %u2013 %u2013 %u2013 %u2013 %u2013 %u2013 %u2013 %u2013Travel and subsistence 11 622 10 798 18 474 18 419 36 473 36 585 20 465 11 666 12 192 (44.1)Training and development %u2013 %u2013 %u2013 %u2013 %u2013 %u2013 140 %u2013 %u2013Operating payments 746 79 114 152 62 87 230 36 38 164.4Venues and facilities 460 183 331 535 562 562 693 542 566 23.3Interest and rent on land 5 25 %u2013 %u2013 %u2013 %u2013 %u2013 %u2013 %u2013Interest (Incl. interest on unitary payments (PPP)) 5 25 %u2013 %u2013 %u2013 %u2013 %u2013 %u2013 %u2013Rent on land %u2013 %u2013 %u2013 %u2013 %u2013 %u2013 %u2013 %u2013 %u2013Transfers and subsidies 5 602 419 335 3 565 615 615 5 000 4 069 4 252 713.0 Provinces and municipalities %u2013 %u2013 %u2013 %u2013 %u2013 %u2013 %u2013 %u2013 %u2013Provinces %u2013 %u2013 %u2013 %u2013 %u2013 %u2013 %u2013 %u2013 %u2013Provincial Revenue Funds %u2013 %u2013 %u2013 %u2013 %u2013 %u2013 %u2013 %u2013 %u2013Provincial agencies and funds %u2013 %u2013 %u2013 %u2013 %u2013 %u2013 %u2013 %u2013 %u2013Municipalities %u2013 %u2013 %u2013 %u2013 %u2013 %u2013 %u2013 %u2013 %u2013Municipal bank accounts %u2013 %u2013 %u2013 %u2013 %u2013 %u2013 %u2013 %u2013 %u2013Municipal agencies and funds %u2013 %u2013 %u2013 %u2013 %u2013 %u2013 %u2013 %u2013 %u2013Departmental agencies and accounts %u2013 %u2013 %u2013 2 565 %u2013 %u2013 4 000 3 019 3 155Social security funds %u2013 %u2013 %u2013 %u2013 %u2013 %u2013 %u2013 %u2013 %u2013Departmental agencies (non-business entities) %u2013 %u2013 %u2013 2 565 %u2013 %u2013 4 000 3 019 3 155Higher education institutions %u2013 %u2013 %u2013 %u2013 %u2013 %u2013 %u2013 %u2013 %u2013Foreign governments and international organisations %u2013 %u2013 %u2013 %u2013 %u2013 %u2013 %u2013 %u2013 %u2013Public corporations and private enterprises %u2013 %u2013 %u2013 %u2013 %u2013 %u2013 %u2013 %u2013 %u2013Public corporations %u2013 %u2013 %u2013 %u2013 %u2013 %u2013 %u2013 %u2013 %u2013Subsidies on products and production (pc) %u2013 %u2013 %u2013 %u2013 %u2013 %u2013 %u2013 %u2013 %u2013Other transfers to public corporations %u2013 %u2013 %u2013 %u2013 %u2013 %u2013 %u2013 %u2013 %u2013Private enterprises %u2013 %u2013 %u2013 %u2013 %u2013 %u2013 %u2013 %u2013 %u2013Subsidies on products and production (pe) %u2013 %u2013 %u2013 %u2013 %u2013 %u2013 %u2013 %u2013 %u2013Other transfers to private enterprises %u2013 %u2013 %u2013 %u2013 %u2013 %u2013 %u2013 %u2013 %u2013Non-profit institutions %u2013 %u2013 %u2013 %u2013 %u2013 %u2013 %u2013 %u2013 %u2013Households 5 602 419 335 1 000 615 615 1 000 1 050 1 097 62.6Social benefits 5 487 211 3 1 000 %u2013 %u2013 %u2013 45 47Other transfers to households 115 208 332 %u2013 615 615 1 000 1 005 1 050 62.6Payments for capital assets 297 %u2013 1 072 3 000 3 160 3 160 4 615 4 076 4 259 46.0Buildings and other fixed structures 297 %u2013 %u2013 %u2013 %u2013 %u2013 %u2013 %u2013 %u2013Buildings 297 %u2013 %u2013 %u2013 %u2013 %u2013 %u2013 %u2013 %u2013Other fixed structures %u2013 %u2013 %u2013 %u2013 %u2013 %u2013 %u2013 %u2013 %u2013Machinery and equipment %u2013 %u2013 1 072 3 000 3 160 3 160 4 615 4 076 4 259 46.0Transport equipment %u2013 %u2013 972 %u2013 %u2013 %u2013 1 500 %u2013 %u2013Other machinery and equipment %u2013 %u2013 100 3 000 3 160 3 160 3 115 4 076 4 259 (1.4)Heritage Assets %u2013 %u2013 %u2013 %u2013 %u2013 %u2013 %u2013 %u2013 %u2013Specialised military assets %u2013 %u2013 %u2013 %u2013 %u2013 %u2013 %u2013 %u2013 %u2013Biological assets %u2013 %u2013 %u2013 %u2013 %u2013 %u2013 %u2013 %u2013 %u2013Land and sub-soil assets %u2013 %u2013 %u2013 %u2013 %u2013 %u2013 %u2013 %u2013 %u2013Software and other intangible assets 0 %u2013 %u2013 %u2013 %u2013 %u2013 %u2013 %u2013 %u2013Payments for financial assets %u2013 %u2013 %u2013 %u2013 %u2013 %u2013 %u2013 %u2013 %u2013Total economic classification 292 641 308 217 332 840 399 508 401 408 398 040 501 727 437 364 457 046 26.02024/25688
