
Page 893 - Demo
P. 893
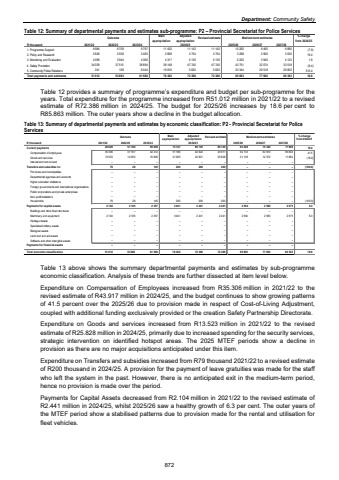
Department: Community Safety Table 12: Summary of departmental payments and estimates sub-programme: P2 %u2013 Provincial Secretariat for Police ServicesOutcome Main appropriationAdjusted appropriation Revised estimate Medium-term estimates % change from 2024/25R thousand 2021/22 2022/23 2023/24 2025/26 2026/27 2027/281. Programme Support 9 984 9 709 9 797 11 432 11 142 11 142 10 260 9 465 9 890 (7.9)2. Policy and Research 2 649 2 556 2 465 2 669 2 754 2 754 3 288 2 900 3 030 19.43. Monitoring and Evaluation 4 099 3 944 4 360 4 317 5 130 5 130 5 220 3 945 4 123 1.84. Safety Promotion 34 039 37 515 38 894 38 148 47 740 47 740 43 751 32 074 33 518 (8.4)5. Community Police Relations 241 169 6 044 19 816 5 620 5 620 23 344 29 518 29 802 315.4Total payments and estimates 51 012 53 893 61 560 76 382 72 386 72 386 85 863 77 902 80 363 18.62024/25 Table 12 provides a summary of programme%u2019s expenditure and budget per sub-programme for the years. Total expenditure for the programme increased from R51.012 million in 2021/22 to a revised estimate of R72.386 million in 2024/25. The budget for 2025/26 increases by 18.6 per cent to R85.863 million. The outer years show a decline in the budget allocation.Table 13: Summary of departmental payments and estimates by economic classification: P2 - Provincial Secretariat for Police ServicesOutcome Main appropriationAdjusted appropriation Revised estimate Medium-term estimates % change from 2024/25R thousand 2021/22 2022/23 2023/24 2025/26 2026/27 2027/28Current payments 51 760 48 829 59 058 73 141 69 745 69 745 83 269 75 342 77 688 19.4Compensation of employees 37 707 35 306 42 212 51 186 44 924 43 917 62 133 62 970 65 804 41.5Goods and services 14 053 13 523 16 846 21 955 24 821 25 828 21 136 12 372 11 884 (18.2)Interest and rent on land %u2013 %u2013 %u2013 %u2013 %u2013 %u2013 %u2013 %u2013 %u2013 Transfers and subsidies to: 28 79 145 200 200 200 %u2013 %u2013 %u2013 (100.0)Provinces and municipalities %u2013 %u2013 %u2013 %u2013 %u2013 %u2013 %u2013 %u2013 %u2013 Departmental agencies and accounts %u2013 %u2013 %u2013 %u2013 %u2013 %u2013 %u2013 %u2013 %u2013 Higher education institutions %u2013 %u2013 %u2013 %u2013 %u2013 %u2013 %u2013 %u2013 %u2013Foreign governments and international organisations %u2013 %u2013 %u2013 %u2013 %u2013 %u2013 %u2013 %u2013 %u2013Public corporations and private enterprises %u2013 %u2013 %u2013 %u2013 %u2013 %u2013 %u2013 %u2013 %u2013Non-profit institutions %u2013 %u2013 %u2013 %u2013 %u2013 %u2013 %u2013 %u2013 %u2013Households 79 28 145 200 200 200 %u2013 %u2013 %u2013 (100.0)Payments for capital assets 2 104 2 105 2 357 3 041 2 441 2 441 2 594 2 560 2 675 6.3Buildings and other fixed structures %u2013 %u2013 %u2013 %u2013 %u2013 %u2013 %u2013 %u2013 %u2013Machinery and equipment 2 104 2 105 2 357 3 041 2 441 2 441 2 594 2 560 2 675 6.3Heritage Assets %u2013 %u2013 %u2013 %u2013 %u2013 %u2013 %u2013 %u2013 %u2013Specialised military assets %u2013 %u2013 %u2013 %u2013 %u2013 %u2013 %u2013 %u2013 %u2013Biological assets %u2013 %u2013 %u2013 %u2013 %u2013 %u2013 %u2013 %u2013 %u2013Land and sub-soil assets %u2013 %u2013 %u2013 %u2013 %u2013 %u2013 %u2013 %u2013 %u2013Software and other intangible assets %u2013 %u2013 %u2013 %u2013 %u2013 %u2013 %u2013 %u2013 %u2013Payments for financial assets %u2013 %u2013 %u2013 %u2013 %u2013 %u2013 %u2013 %u2013 %u2013Total economic classification 51 012 53 893 61 560 76 382 72 386 72 386 85 863 77 902 80 363 18.62024/25Table 13 above shows the summary departmental payments and estimates by sub-programme economic classification. Analysis of these trends are further dissected at item level below. Expenditure on Compensation of Employees increased from R35.306 million in 2021/22 to the revised estimate of R43.917 million in 2024/25, and the budget continues to show growing patterns of 41.5 percent over the 2025/26 due to provision made in respect of Cost-of-Living Adjustment, coupled with additional funding exclusively provided or the creation Safety Partnership Directorate. Expenditure on Goods and services increased from R13.523 million in 2021/22 to the revised estimate of R25.828 million in 2024/25, primarily due to increased spending for the security services, strategic intervention on identified hotspot areas. The 2025 MTEF periods show a decline in provision as there are no major acquisitions anticipated under this item. Expenditure on Transfers and subsidies increased from R79 thousand 2021/22 to a revised estimate of R200 thousand in 2024/25. A provision for the payment of leave gratuities was made for the staff who left the system in the past. However, there is no anticipated exit in the medium-term period, hence no provision is made over the period. Payments for Capital Assets decreased from R2.104 million in 2021/22 to the revised estimate of R2.441 million in 2024/25, whilst 2025/26 saw a healthy growth of 6.3 per cent. The outer years of the MTEF period show a stabilised patterns due to provision made for the rental and utilisation for fleet vehicles. 872
