
Page 898 - Demo
P. 898
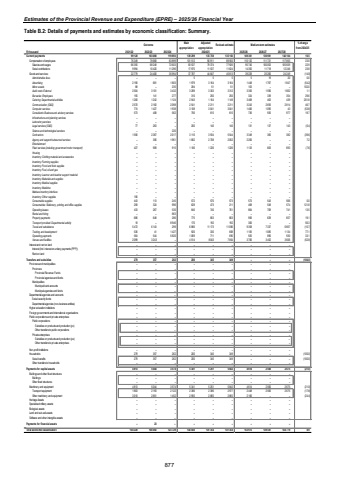
Estimates of the Provincial Revenue and Expenditure (EPRE) %u2013 2025/26 Financial YearTable B.2: Details of payments and estimates by economic classification: Summary. Outcome Main appropriationAdjusted appropriation Revised estimate Medium-term estimates % change from 2024/25R thousand 2021/22 2022/23 2023/24 2025/26 2026/27 2027/28Current payments 103 068 99 128 119 893 139 299 135 758 135 163 149 361 136 981 142 104 10.5Compensation of employees 76 349 78 668 83 899 101 512 90 911 89 550 110 132 111 721 117 855 23.0Salaries and wages 66 355 68 248 72 603 83 537 79 374 77 926 95 740 100 003 105 609 22.9Social contributions 9 994 10 420 11 296 17 975 11 537 11 624 14 392 11 718 12 246 23.8Goods and services 24 400 22 779 35 994 37 787 44 847 45 613 39 229 25 260 24 249 (14.0)Administrative fees %u2013 %u2013 %u2013 5 5 5 5 19 20 0.0Advertising 2 190 681 1 803 1 979 3 164 3 164 1 448 1 767 1 847 (54.2)Minor assets 88 %u2013 235 284 51 51 103 %u2013 %u2013 102.0Audit costs: External 2 504 3 101 3 432 3 289 3 303 3 312 3 350 1 590 1 662 1.1Bursaries: Employees 155 141 277 310 250 250 324 339 354 29.6Catering: Departmental activities 1 200 1 242 1 124 2 943 1 164 1 149 3 468 463 439 201.8Communication (G&S) 2 570 2 182 2 098 2 541 2 211 2 211 3 243 2 693 2 814 46.7Computer services 774 1 427 1 938 3 108 3 041 3 041 1 406 1 095 43 (53.8)Consultants: Business and advisory services 573 408 562 756 615 615 736 935 977 19.7Infrastructure and planning services %u2013 %u2013 %u2013 %u2013 %u2013 %u2013 %u2013 %u2013 %u2013Laboratory services %u2013 %u2013 %u2013 %u2013 %u2013 %u2013 %u2013 %u2013 %u2013Legal services (G&S) 77 263 %u2013 200 140 140 131 137 143 (6.4)Science and technological services %u2013 %u2013 220 %u2013 %u2013 %u2013 %u2013 %u2013 %u2013Contractors 1 556 2 367 2 017 3 110 3 934 5 544 3 349 365 382 (39.6)Agency and support/outsourced services %u2013 356 1 961 1 802 2 708 2 052 2 200 %u2013 %u2013 7.2Entertainment %u2013 %u2013 %u2013 %u2013 %u2013 %u2013 %u2013 %u2013 %u2013Fleet services (including government motor transport) 427 909 915 1 106 1 226 1 226 1 133 663 693 (7.6)Housing %u2013 %u2013 %u2013 %u2013 %u2013 %u2013 %u2013 %u2013 %u2013Inventory: Clothing material and accessories %u2013 %u2013 %u2013 %u2013 %u2013 %u2013 %u2013 %u2013 %u2013Inventory: Farming supplies %u2013 %u2013 %u2013 %u2013 %u2013 %u2013 %u2013 %u2013 %u2013Inventory: Food and food supplies %u2013 %u2013 %u2013 %u2013 %u2013 %u2013 %u2013 %u2013 %u2013Inventory: Fuel, oil and gas %u2013 %u2013 %u2013 %u2013 %u2013 %u2013 %u2013 %u2013 %u2013Inventory: Learner and teacher support material %u2013 %u2013 %u2013 %u2013 %u2013 %u2013 %u2013 %u2013 %u2013Inventory: Materials and supplies %u2013 %u2013 %u2013 %u2013 %u2013 %u2013 %u2013 %u2013 %u2013Inventory: Medical supplies %u2013 %u2013 %u2013 %u2013 %u2013 %u2013 %u2013 %u2013 %u2013Inventory: Medicine %u2013 %u2013 %u2013 %u2013 %u2013 %u2013 %u2013 %u2013 %u2013Medsas inventory interface %u2013 %u2013 %u2013 %u2013 %u2013 %u2013 %u2013 %u2013 %u2013Inventory: Other supplies 156 %u2013 %u2013 %u2013 %u2013 %u2013 %u2013 %u2013 %u2013Consumable supplies 443 113 245 572 570 573 573 543 566 0.0Consumables: Stationery, printing and office supplies 258 324 996 628 473 211 468 549 574 121.8Operating leases 433 267 530 840 740 761 864 709 741 13.5Rental and hiring %u2013 %u2013 863 %u2013 %u2013 %u2013 %u2013 %u2013 %u2013Property payments 686 648 286 775 803 803 956 629 657 19.1Transport provided: Departmental activity 18 %u2013 8 946 170 192 192 300 %u2013 %u2013 56.3Travel and subsistence 5 472 6 143 299 6 866 11 173 11 096 9 358 7 337 6 667 (15.7)Training and development 536 41 1 427 920 330 668 1 183 1 085 1 134 77.1Operating payments 564 544 5 820 1 069 711 695 925 890 930 33.1Venues and facilities 2 099 3 243 %u2013 4 514 8 043 7 854 3 706 3 452 3 606 (52.8)Interest and rent on land %u2013 %u2013 %u2013 %u2013 %u2013 %u2013 %u2013 %u2013 %u2013Interest (Incl. interest on unitary payments (PPP)) %u2013 %u2013 %u2013 %u2013 %u2013 %u2013 %u2013 %u2013 %u2013Rent on land %u2013 %u2013 %u2013 %u2013 %u2013 %u2013 %u2013 %u2013 %u2013Transfers and subsidies 279 357 262 200 345 349 %u2013 %u2013 %u2013 (100.0)Provinces and municipalities %u2013 %u2013 %u2013 %u2013 %u2013 %u2013 %u2013 %u2013 %u2013Provinces %u2013 %u2013 %u2013 %u2013 %u2013 %u2013 %u2013 %u2013 %u2013Provincial Revenue Funds %u2013 %u2013 %u2013 %u2013 %u2013 %u2013 %u2013 %u2013 %u2013Provincial agencies and funds %u2013 %u2013 %u2013 %u2013 %u2013 %u2013 %u2013 %u2013 %u2013Municipalities %u2013 %u2013 %u2013 %u2013 %u2013 %u2013 %u2013 %u2013 %u2013Municipal bank accounts %u2013 %u2013 %u2013 %u2013 %u2013 %u2013 %u2013 %u2013 %u2013Municipal agencies and funds %u2013 %u2013 %u2013 %u2013 %u2013 %u2013 %u2013 %u2013 %u2013Departmental agencies and accounts %u2013 %u2013 %u2013 %u2013 %u2013 %u2013 %u2013 %u2013 %u2013Social security funds %u2013 %u2013 %u2013 %u2013 %u2013 %u2013 %u2013 %u2013 %u2013Departmental agencies (non-business entities) %u2013 %u2013 %u2013 %u2013 %u2013 %u2013 %u2013 %u2013 %u2013Higher education institutions %u2013 %u2013 %u2013 %u2013 %u2013 %u2013 %u2013 %u2013 %u2013Foreign governments and international organisations %u2013 %u2013 %u2013 %u2013 %u2013 %u2013 %u2013 %u2013 %u2013Public corporations and private enterprises %u2013 %u2013 %u2013 %u2013 %u2013 %u2013 %u2013 %u2013 %u2013Public corporations %u2013 %u2013 %u2013 %u2013 %u2013 %u2013 %u2013 %u2013 %u2013Subsidies on products and production (pc) %u2013 %u2013 %u2013 %u2013 %u2013 %u2013 %u2013 %u2013 %u2013Other transfers to public corporations %u2013 %u2013 %u2013 %u2013 %u2013 %u2013 %u2013 %u2013 %u2013Private enterprises %u2013 %u2013 %u2013 %u2013 %u2013 %u2013 %u2013 %u2013 %u2013Subsidies on products and production (pe) %u2013 %u2013 %u2013 %u2013 %u2013 %u2013 %u2013 %u2013 %u2013Other transfers to private enterprises %u2013 %u2013 %u2013 %u2013 %u2013 %u2013 %u2013 %u2013 %u2013Non-profit institutions %u2013 %u2013 %u2013 %u2013 %u2013 %u2013 %u2013 %u2013 %u2013Households 279 357 262 200 345 349 %u2013 %u2013 %u2013 (100.0)Social benefits 279 357 262 200 345 349 %u2013 %u2013 %u2013 (100.0)Other transfers to households %u2013 %u2013 %u2013 %u2013 %u2013 %u2013 %u2013 %u2013 %u2013Payments for capital assets 4 813 5 044 3 574 5 341 5 251 5 842 4 614 2 560 2 675 (21.0)Buildings and other fixed structures %u2013 %u2013 %u2013 %u2013 %u2013 %u2013 %u2013 %u2013 %u2013Buildings %u2013 %u2013 %u2013 %u2013 %u2013 %u2013 %u2013 %u2013 %u2013Other fixed structures %u2013 %u2013 %u2013 %u2013 %u2013 %u2013 %u2013 %u2013 %u2013Machinery and equipment 4 813 5 044 3 574 5 341 5 251 5 842 4 614 2 560 2 675 (21.0)Transport equipment 1 803 2 193 2 122 2 386 2 386 2 977 2 448 2 560 2 675 (17.8)Other machinery and equipment 3 010 2 851 1 452 2 955 2 865 2 865 2 166 %u2013 %u2013 (24.4)Heritage Assets %u2013 %u2013 %u2013 %u2013 %u2013 %u2013 %u2013 %u2013 %u2013Specialised military assets %u2013 %u2013 %u2013 %u2013 %u2013 %u2013 %u2013 %u2013 %u2013Biological assets %u2013 %u2013 %u2013 %u2013 %u2013 %u2013 %u2013 %u2013 %u2013Land and sub-soil assets %u2013 %u2013 %u2013 %u2013 %u2013 %u2013 %u2013 %u2013 %u2013Software and other intangible assets %u2013 %u2013 %u2013 %u2013 %u2013 %u2013 %u2013 %u2013 %u2013Payments for financial assets %u2013 23 %u2013 %u2013 %u2013 %u2013 %u2013 %u2013 %u2013Total economic classification 104 220 108 492 123 729 144 840 141 354 141 354 153 975 139 541 144 779 8.92024/25877
