
Page 899 - Demo
P. 899
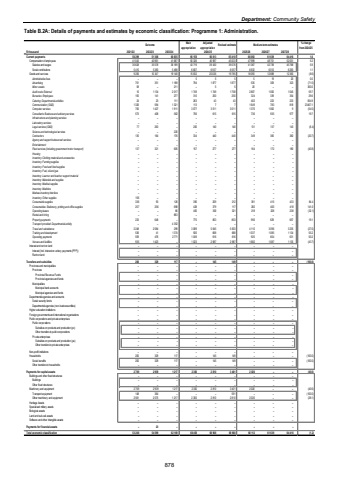
Department: Community Safety Table B.2A: Details of payments and estimates by economic classification: Programme 1: Administration.Outcome Main appropriationAdjusted appropriation Revised estimate Medium-term estimates % change from 2024/25R thousand 2021/22 2022/23 2023/24 2025/26 2026/27 2027/28Current payments 50 299 51 308 60 835 66 158 66 013 65 418 66 092 61 639 64 416 1.0Compensation of employees 41 043 40 961 41 687 50 326 45 987 45 633 47 999 48 751 52 051 5.2Salaries and wages 35 628 35 578 36 189 43 719 39 430 39 076 41 367 42 739 45 768 5.9Social contributions 5 415 5 383 5 498 6 607 6 557 6 557 6 632 6 012 6 283 1.1Goods and services 9 256 10 347 19 148 15 832 20 026 19 785 18 093 12 888 12 365 (8.6)Administrative fees %u2013 %u2013 %u2013 5 5 5 5 19 20 0.0Advertising 751 351 1 188 794 1 877 1 877 535 309 323 (71.5)Minor assets 58 %u2013 211 %u2013 5 5 20 %u2013 %u2013 300.0Audit costs: External 10 1 134 2 017 1 749 1 749 1 758 2 807 1 000 1 045 59.7Bursaries: Employees 155 141 277 310 250 250 324 339 354 29.6Catering: Departmental activities 24 23 111 263 43 43 402 223 233 834.9Communication (G&S) 1 326 594 1 321 113 7 7 1 649 783 818 23457.1Computer services 750 1 427 1 911 3 077 3 011 3 011 1 370 1 062 9 (54.5)Consultants: Business and advisory services 573 408 562 756 615 615 736 935 977 19.7Infrastructure and planning services %u2013 %u2013 %u2013 %u2013 %u2013 %u2013 %u2013 %u2013 %u2013Laboratory services %u2013 %u2013 %u2013 %u2013 %u2013 %u2013 %u2013 %u2013 %u2013Legal services (G&S) 77 263 %u2013 200 140 140 131 137 143 (6.4)Science and technological services %u2013 %u2013 220 %u2013 %u2013 %u2013 %u2013 %u2013 %u2013Contractors 135 164 176 334 440 440 349 365 382 (20.7)Agency and support/outsourced services %u2013 %u2013 %u2013 %u2013 %u2013 %u2013 %u2013 %u2013 %u2013Entertainment %u2013 %u2013 %u2013 %u2013 %u2013 %u2013 %u2013 %u2013 %u2013Fleet services (including government motor transport) 137 321 605 157 277 277 164 172 180 (40.8)Housing %u2013 %u2013 %u2013 %u2013 %u2013 %u2013 %u2013 %u2013 %u2013Inventory: Clothing material and accessories %u2013 %u2013 %u2013 %u2013 %u2013 %u2013 %u2013 %u2013 %u2013Inventory: Farming supplies %u2013 %u2013 %u2013 %u2013 %u2013 %u2013 %u2013 %u2013 %u2013Inventory: Food and food supplies %u2013 %u2013 %u2013 %u2013 %u2013 %u2013 %u2013 %u2013 %u2013Inventory: Fuel, oil and gas %u2013 %u2013 %u2013 %u2013 %u2013 %u2013 %u2013 %u2013 %u2013Inventory: Learner and teacher support material %u2013 %u2013 %u2013 %u2013 %u2013 %u2013 %u2013 %u2013 %u2013Inventory: Materials and supplies %u2013 %u2013 %u2013 %u2013 %u2013 %u2013 %u2013 %u2013 %u2013Inventory: Medical supplies %u2013 %u2013 %u2013 %u2013 %u2013 %u2013 %u2013 %u2013 %u2013Inventory: Medicine %u2013 %u2013 %u2013 %u2013 %u2013 %u2013 %u2013 %u2013 %u2013Medsas inventory interface %u2013 %u2013 %u2013 %u2013 %u2013 %u2013 %u2013 %u2013 %u2013Inventory: Other supplies 156 %u2013 %u2013 %u2013 %u2013 %u2013 %u2013 %u2013 %u2013Consumable supplies 336 93 126 390 209 212 391 415 433 84.4Consumables: Stationery, printing and office supplies 257 256 698 428 379 117 282 400 418 141.0Operating leases %u2013 %u2013 66 400 300 321 218 228 238 (32.1)Rental and hiring %u2013 %u2013 863 %u2013 %u2013 %u2013 %u2013 %u2013 %u2013Property payments 233 648 %u2013 775 803 803 956 629 657 19.1Transport provided: Departmental activity %u2013 %u2013 4 352 %u2013 %u2013 %u2013 %u2013 %u2013 %u2013Travel and subsistence 2 248 2 584 299 3 089 5 645 5 633 4 110 3 096 3 235 (27.0)Training and development 536 41 1 374 920 668 668 1 037 1 085 1 134 55.2Operating payments 559 476 2 771 1 049 616 616 925 604 631 50.2Venues and facilities 935 1 423 %u2013 1 023 2 987 2 987 1 682 1 087 1 135 (43.7)Interest and rent on land %u2013 %u2013 %u2013 %u2013 %u2013 %u2013 %u2013 %u2013 %u2013Interest (Incl. interest on unitary payments (PPP)) %u2013 %u2013 %u2013 %u2013 %u2013 %u2013 %u2013 %u2013 %u2013Rent on land %u2013 %u2013 %u2013 %u2013 %u2013 %u2013 %u2013 %u2013 %u2013Transfers and subsidies 200 329 117 %u2013 145 149 %u2013 %u2013 %u2013 (100.0)Provinces and municipalities %u2013 %u2013 %u2013 %u2013 %u2013 %u2013 %u2013 %u2013 %u2013Provinces %u2013 %u2013 %u2013 %u2013 %u2013 %u2013 %u2013 %u2013 %u2013Provincial Revenue Funds %u2013 %u2013 %u2013 %u2013 %u2013 %u2013 %u2013 %u2013 %u2013Provincial agencies and funds %u2013 %u2013 %u2013 %u2013 %u2013 %u2013 %u2013 %u2013 %u2013Municipalities %u2013 %u2013 %u2013 %u2013 %u2013 %u2013 %u2013 %u2013 %u2013Municipal bank accounts %u2013 %u2013 %u2013 %u2013 %u2013 %u2013 %u2013 %u2013 %u2013Municipal agencies and funds %u2013 %u2013 %u2013 %u2013 %u2013 %u2013 %u2013 %u2013 %u2013Departmental agencies and accounts %u2013 %u2013 %u2013 %u2013 %u2013 %u2013 %u2013 %u2013 %u2013Social security funds %u2013 %u2013 %u2013 %u2013 %u2013 %u2013 %u2013 %u2013 %u2013Departmental agencies (non-business entities) %u2013 %u2013 %u2013 %u2013 %u2013 %u2013 %u2013 %u2013 %u2013Higher education institutions %u2013 %u2013 %u2013 %u2013 %u2013 %u2013 %u2013 %u2013 %u2013Foreign governments and international organisations %u2013 %u2013 %u2013 %u2013 %u2013 %u2013 %u2013 %u2013 %u2013Public corporations and private enterprises %u2013 %u2013 %u2013 %u2013 %u2013 %u2013 %u2013 %u2013 %u2013Public corporations %u2013 %u2013 %u2013 %u2013 %u2013 %u2013 %u2013 %u2013 %u2013Subsidies on products and production (pc) %u2013 %u2013 %u2013 %u2013 %u2013 %u2013 %u2013 %u2013 %u2013Other transfers to public corporations %u2013 %u2013 %u2013 %u2013 %u2013 %u2013 %u2013 %u2013 %u2013Private enterprises %u2013 %u2013 %u2013 %u2013 %u2013 %u2013 %u2013 %u2013 %u2013Subsidies on products and production (pe) %u2013 %u2013 %u2013 %u2013 %u2013 %u2013 %u2013 %u2013 %u2013Other transfers to private enterprises %u2013 %u2013 %u2013 %u2013 %u2013 %u2013 %u2013 %u2013 %u2013Non-profit institutions %u2013 %u2013 %u2013 %u2013 %u2013 %u2013 %u2013 %u2013 %u2013Households 200 329 117 %u2013 145 149 %u2013 %u2013 %u2013 (100.0)Social benefits 200 329 117 %u2013 145 149 %u2013 %u2013 %u2013 (100.0)Other transfers to households %u2013 %u2013 %u2013 %u2013 %u2013 %u2013 %u2013 %u2013 %u2013Payments for capital assets 2 709 2 939 1 217 2 300 2 810 3 401 2 020 %u2013 %u2013 (40.6)Buildings and other fixed structures %u2013 %u2013 %u2013 %u2013 %u2013 %u2013 %u2013 %u2013 %u2013Buildings %u2013 %u2013 %u2013 %u2013 %u2013 %u2013 %u2013 %u2013 %u2013Other fixed structures %u2013 %u2013 %u2013 %u2013 %u2013 %u2013 %u2013 %u2013 %u2013Machinery and equipment 2 709 2 939 1 217 2 300 2 810 3 401 2 020 %u2013 %u2013 (40.6)Transport equipment 148 364 %u2013 %u2013 %u2013 591 %u2013 %u2013 %u2013 (100.0)Other machinery and equipment 2 561 2 575 1 217 2 300 2 810 2 810 2 020 %u2013 %u2013 (28.1)Heritage Assets %u2013 %u2013 %u2013 %u2013 %u2013 %u2013 %u2013 %u2013 %u2013Specialised military assets %u2013 %u2013 %u2013 %u2013 %u2013 %u2013 %u2013 %u2013 %u2013Biological assets %u2013 %u2013 %u2013 %u2013 %u2013 %u2013 %u2013 %u2013 %u2013Land and sub-soil assets %u2013 %u2013 %u2013 %u2013 %u2013 %u2013 %u2013 %u2013 %u2013Software and other intangible assets %u2013 %u2013 %u2013 %u2013 %u2013 %u2013 %u2013 %u2013 %u2013Payments for financial assets %u2013 23 %u2013 %u2013 %u2013 %u2013 %u2013 %u2013 %u2013Total economic classification 53 208 54 599 62 169 68 458 68 968 68 968 68 112 61 639 64 416 (1.2)2024/25878
