
Page 431 - Provincial Treasury Estimates.pdf
P. 431
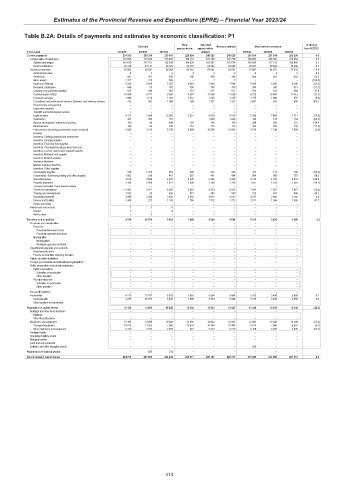
Estimates of the Provincial Revenue and Expenditure (EPRE) – Financial Year 2023/24
Table B.2A: Details of payments and estimates by economic classification: P1
Main Adjusted % change
Outcome Revised estimate Medium-term estimates
appropriation appropriation from 2022/23
R thousand 2019/20 2020/21 2021/22 2022/23 2023/24 2024/25 2025/26
Current payments 234 995 209 356 235 143 229 884 246 820 246 820 256 674 261 354 269 806 4.0
Compensation of employees 172 095 170 832 175 883 189 101 187 759 187 759 194 987 206 383 212 464 3.8
Salaries and wages 149 679 147 701 152 309 164 829 163 557 163 074 168 060 177 715 182 458 3.1
Social contributions 22 416 23 131 23 574 24 272 24 202 24 685 26 927 28 668 30 006 9.1
Goods and services 62 893 38 521 59 254 40 783 59 061 59 061 61 687 54 971 57 342 4.4
Administrative fees 4 5 5 3 3 3 3 3 3 0.0
Advertising 547 351 565 108 396 396 604 362 462 52.5
Minor assets 1 127 225 303 – 2 2 – – – (100.0)
Audit cost: External 5 300 3 619 5 553 3 819 7 094 7 094 5 569 5 820 6 106 (21.5)
Bursaries: Employees 646 53 392 300 700 700 300 300 313 (57.1)
Catering: Departmental activities 917 296 263 372 517 517 764 615 568 47.8
Communication (G&S) 10 594 9 771 9 930 8 387 11 058 11 058 9 720 10 904 11 412 (12.1)
Computer services 1 886 1 110 1 184 1 212 1 235 1 235 1 175 1 089 978 (4.9)
Consultants and professional services: Business and advisory services 732 962 1 089 789 1 227 1 227 5 687 942 986 363.5
Infrastructure and planning – – – – – – – – –
Laboratory services – – – – – – – – –
Scientific and technological services – – – – – – – – –
Legal services 6 117 1 004 12 992 2 921 6 018 6 018 5 388 7 408 7 711 (10.5)
Contractors 407 452 151 – 1 028 1 028 180 134 134 (82.5)
Agency and support / outsourced services 100 89 839 154 140 140 289 329 372 106.4
Entertainment 128 82 136 112 115 115 102 100 102 (11.3)
Fleet services (including government motor transport) 6 690 4 155 6 736 6 000 10 000 10 000 9 720 7 739 7 909 (2.8)
Housing – – – – – – – – –
Inventory: Clothing material and accessories – – – – – – – – –
Inventory: Farming supplies – – – – – – – – –
Inventory: Food and food supplies – – – – – – – – –
Inventory: Chemicals,fuel,oil,gas,wood and coal – – – – – – – – –
Inventory: Learner and teacher support material – – – – – – – – –
Inventory: Materials and supplies – – – – – – – – –
Inventory: Medical supplies – – – – – – – – –
Inventory: Medicine – – – – – – – – –
Medsas inventory interface – – – – – – – – –
Inventory: Other supplies – – – – – – – – –
Consumable supplies 518 1 355 253 295 233 240 107 112 165 (55.4)
Consumable: Stationery,printing and office supplies 1 063 939 461 557 491 484 964 688 757 99.2
Operating leases 3 678 4 500 4 870 5 225 2 096 2 096 4 376 4 376 4 572 108.8
Property payments 2 168 2 408 1 671 1 239 1 789 1 789 1 537 1 513 1 581 (14.1)
Transport provided: Departmental activity – – – – – – – – –
Travel and subsistence 12 861 3 427 6 455 5 002 8 533 8 533 7 642 7 397 7 657 (10.4)
Training and development 1 002 20 426 871 563 563 812 831 866 44.2
Operating payments 3 999 3 426 3 820 2 652 4 051 4 051 4 237 2 943 3 162 4.6
Venues and facilities 2 409 272 1 160 765 1 772 1 772 2 511 1 366 1 526 41.7
Rental and hiring – – – – – – – – –
Interest and rent on land 7 3 6 – – – – – –
Interest 7 – 6 – – – – – –
Rent on land – 3 – – – – – – –
Transfers and subsidies 4 725 22 761 6 833 1 885 5 004 5 004 5 313 3 496 3 656 6.2
Provinces and municipalities – – – – – – – – –
Provinces – – – – – – – – –
Provincial Revenue Funds – – – – – – – – –
Provincial agencies and funds – – – – – – – – –
Municipalities – – – – – – – – –
Municipalities – – – – – – – – –
Municipal agencies and funds – – – – – – – – –
Departmental agencies and accounts – – – – – – – – –
Social security funds – – – – – – – – –
Provide list of entities receiving transfers – – – – – – – – –
Higher education institutions – – – – – – – – –
Foreign governments and international organisations – – – – – – – – –
Public corporations and private enterprises – – – – – – – – –
Public corporations – – – – – – – – –
Subsidies on production – – – – – – – – –
Other transfers – – – – – – – – –
Private enterprises – – – – – – – – –
Subsidies on production – – – – – – – – –
Other transfers – – – – – – – – –
Non-profit institutions – – – – – – – – –
Households 4 725 22 761 6 833 1 885 5 004 5 004 5 313 3 496 3 656 6.2
Social benefits 4 725 22 761 6 833 1 885 5 004 5 004 5 313 3 496 3 656 6.2
Other transfers to households – – – – – – – – –
Payments for capital assets 15 195 14 895 10 828 13 902 16 923 16 923 13 482 10 036 14 048 (20.3)
Buildings and other fixed structures – – – – – – – – –
Buildings – – – – – – – – –
Other fixed structures – – – – – – – – –
Machinery and equipment 15 195 14 895 10 828 13 902 16 923 16 923 12 982 10 036 14 048 (23.3)
Transport equipment 10 070 11 352 7 950 12 978 10 404 10 404 9 874 7 996 8 353 (5.1)
Other machinery and equipment 5 125 3 543 2 878 924 6 519 6 519 3 108 2 040 5 695 (52.3)
Heritage Assets – – – – – – – – –
Specialised military assets – – – – – – – – –
Biological assets – – – – – – – – –
Land and sub-soil assets – – – – – – – – –
Software and other intangible assets – – – – – – 500 – –
Payments for financial assets – 557 734 – – – – – –
Total economic classification 254 915 247 569 253 538 245 671 268 747 268 747 275 469 274 886 287 510 2.5
414