
Page 433 - Provincial Treasury Estimates.pdf
P. 433
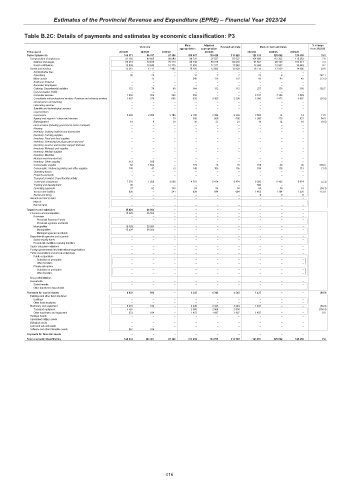
Estimates of the Provincial Revenue and Expenditure (EPRE) – Financial Year 2023/24
Table B.2C: Details of payments and estimates by economic classification: P3
Main Adjusted % change
Outcome Revised estimate Medium-term estimates
appropriation appropriation from 2022/23
R thousand 2019/20 2020/21 2021/22 2022/23 2023/24 2024/25 2025/26
Current payments 106 373 96 397 97 380 108 947 110 420 110 420 121 614 125 892 129 459 10.1
Compensation of employees 91 158 89 686 89 888 98 791 97 527 97 527 104 899 112 332 115 363 7.6
Salaries and wages 80 219 78 846 79 113 86 736 85 016 85 579 91 851 98 425 100 914 7.3
Social contributions 10 939 10 840 10 775 12 055 12 511 11 948 13 048 13 907 14 449 9.2
Goods and services 15 215 6 711 7 492 10 156 12 893 12 893 16 715 13 560 14 096 29.6
Administrative fees – – – – – – – – –
Advertising 38 20 – 12 7 7 25 6 – 257.1
Minor assets – 15 – 240 170 170 45 45 45 (73.5)
Audit cost: External – – – – – – – – –
Bursaries: Employees – – – – – – – – –
Catering: Departmental activities 372 76 60 164 112 112 227 176 180 102.7
Communication (G&S) – – – – – – – – –
Computer services 1 553 250 232 250 – – 3 151 4 160 4 329
Consultants and professional services: Business and advisory services 1 907 378 655 820 3 305 3 305 2 050 1 472 1 482 (38.0)
Infrastructure and planning – – – – – – – – –
Laboratory services – – – – – – – – –
Scientific and technological services – – – – – – – – –
Legal services – – – – – – – – –
Contractors 2 483 2 053 2 186 2 150 2 294 2 294 2 558 14 14 11.5
Agency and support / outsourced services – – 70 500 608 608 1 000 779 821 64.5
Entertainment 18 9 10 30 21 21 19 14 16 (9.5)
Fleet services (including government motor transport) – – – – – – – – –
Housing – – – – – – – – –
Inventory: Clothing material and accessories – – – – – – – – –
Inventory: Farming supplies – – – – – – – – –
Inventory: Food and food supplies – – – – – – – – –
Inventory: Chemicals,fuel,oil,gas,wood and coal – – – – – – – – –
Inventory: Learner and teacher support material – – – – – – – – –
Inventory: Materials and supplies – – – – – – – – –
Inventory: Medical supplies – – – – – – – – –
Inventory: Medicine – – – – – – – – –
Medsas inventory interface – – – – – – – – –
Inventory: Other supplies 413 915 – – – – – – –
Consumable supplies 50 1 603 – 179 25 25 159 40 45 536.0
Consumable: Stationery,printing and office supplies 100 41 73 148 105 105 104 116 113 (1.0)
Operating leases – – – – – – – – –
Property payments – – – – – – – – –
Transport provided: Departmental activity – – – – – – – – –
Travel and subsistence 7 276 1 289 3 835 4 751 5 474 5 474 5 350 5 492 5 674 (2.3)
Training and development 30 – – – – – 500 – –
Operating payments 37 62 130 74 88 88 58 56 51 (34.1)
Venues and facilities 938 – 241 838 684 684 1 463 1 184 1 320 113.9
Rental and hiring – – – – – – 6 6 6
Interest and rent on land – – – – – – – – –
Interest – – – – – – – – –
Rent on land – – – – – – – – –
Transfers and subsidies 15 429 26 504 – – – – – – –
Provinces and municipalities 15 429 26 504 – – – – – – –
Provinces – – – – – – – – –
Provincial Revenue Funds – – – – – – – – –
Provincial agencies and funds – – – – – – – – –
Municipalities 15 429 26 504 – – – – – – –
Municipalities 15 429 26 504 – – – – – – –
Municipal agencies and funds – – – – – – – – –
Departmental agencies and accounts – – – – – – – – –
Social security funds – – – – – – – – –
Provide list of entities receiving transfers – – – – – – – – –
Higher education institutions – – – – – – – – –
Foreign governments and international organisations – – – – – – – – –
Public corporations and private enterprises – – – – – – – – –
Public corporations – – – – – – – – –
Subsidies on production – – – – – – – – –
Other transfers – – – – – – – – –
Private enterprises – – – – – – – – –
Subsidies on production – – – – – – – – –
Other transfers – – – – – – – – –
Non-profit institutions – – – – – – – – –
Households – – – – – – – – –
Social benefits – – – – – – – – –
Other transfers to households – – – – – – – – –
Payments for capital assets 6 832 500 – 4 345 4 345 4 345 1 437 – – (66.9)
Buildings and other fixed structures – – – – – – – – –
Buildings – – – – – – – – –
Other fixed structures – – – – – – – – –
Machinery and equipment 5 970 164 – 4 345 4 345 4 345 1 437 – – (66.9)
Transport equipment 5 597 – – 2 908 2 908 2 908 – – – (100.0)
Other machinery and equipment 373 164 – 1 437 1 437 1 437 1 437 – – 0.0
Heritage Assets – – – – – – – – –
Specialised military assets – – – – – – – – –
Biological assets – – – – – – – – –
Land and sub-soil assets – – – – – – – – –
Software and other intangible assets 862 336 – – – – – – –
Payments for financial assets – – – – – – – – –
Total economic classification 128 634 123 401 97 380 113 292 114 765 114 765 123 051 125 892 129 459 7.2
416