
Page 430 - Provincial Treasury Estimates.pdf
P. 430
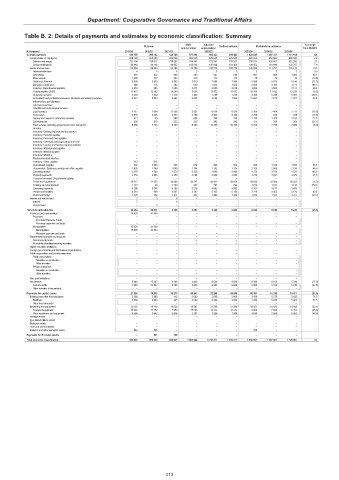
Department: Cooperative Governance and Traditional Affairs
Table B. 2: Details of payments and estimates by economic classification: Summary
Main Adjusted % change
Outcome Revised estimate Medium-term estimates
appropriation appropriation from 2022/23
R thousand 2019/20 2020/21 2021/22 2022/23 2023/24 2024/25 2025/26
Current payments 940 755 895 102 928 728 977 494 985 423 985 423 1 025 527 1 067 351 1 101 164 4.1
Compensation of employees 828 190 835 205 836 539 899 335 879 645 879 645 905 323 955 560 985 045 2.9
Salaries and wages 733 104 739 017 739 587 794 301 773 741 778 237 795 871 838 661 862 258 2.3
Social contributions 95 086 96 188 96 952 105 034 105 904 101 408 109 452 116 899 122 787 7.9
Goods and services 112 558 59 894 92 183 78 159 105 778 105 778 120 204 111 791 116 119 13.6
Administrative fees 4 5 5 3 3 3 3 3 3 0.0
Advertising 618 432 868 260 547 548 987 848 1 062 80.1
Minor assets 1 526 442 303 240 172 172 45 45 45 (73.8)
Audit cost: External 5 300 3 619 5 553 3 819 7 094 7 094 5 569 5 820 6 106 (21.5)
Bursaries: Employees 696 176 392 620 1 020 1 020 2 920 3 160 3 173 186.3
Catering: Departmental activities 3 016 965 1 825 2 611 3 085 3 076 3 900 3 995 4 111 26.8
Communication (G&S) 11 415 12 162 10 240 8 636 11 472 11 472 10 760 11 632 12 250 (6.2)
Computer services 3 439 1 360 1 416 1 462 1 235 1 235 4 326 5 249 5 307 250.3
Consultants and professional services: Business and advisory services 9 621 2 833 4 462 5 405 7 604 7 604 11 661 7 276 7 477 53.4
Infrastructure and planning – – – – – – – – –
Laboratory services – – – – – – – – –
Scientific and technological services – – – – – – – – –
Legal services 6 117 1 004 13 156 2 921 6 018 6 018 5 388 7 408 7 711 (10.5)
Contractors 2 970 2 505 2 337 2 150 3 322 3 322 2 785 228 228 (16.2)
Agency and support / outsourced services 421 89 909 654 748 748 1 289 1 108 1 193 72.3
Entertainment 226 218 232 256 242 242 175 360 365 (27.7)
Fleet services (including government motor transport) 6 690 4 155 6 736 6 365 10 335 10 335 9 720 7 739 7 909 (6.0)
Housing – – – – – – – – –
Inventory: Clothing material and accessories – – – – – – – – –
Inventory: Farming supplies – – – – – – – – –
Inventory: Food and food supplies – – – – – – – – –
Inventory: Chemicals,fuel,oil,gas,wood and coal – – – – – – – – –
Inventory: Learner and teacher support material – – – – – – – – –
Inventory: Materials and supplies – – – – – – – – –
Inventory: Medical supplies – – – – – – – – –
Inventory: Medicine – – – – – – – – –
Medsas inventory interface – – – – – – – – –
Inventory: Other supplies 413 915 – – – – – – –
Consumable supplies 807 3 569 526 674 488 502 929 1 574 1 652 85.1
Consumable: Stationery,printing and office supplies 1 835 1 788 1 059 1 704 1 142 1 134 2 120 2 049 2 188 86.9
Operating leases 3 678 4 500 4 870 5 225 2 096 2 096 4 376 4 376 4 572 108.8
Property payments 2 550 2 948 2 256 2 094 2 644 2 644 3 214 3 991 4 079 21.6
Transport provided: Departmental activity – – – – – – – – –
Travel and subsistence 39 317 11 075 24 100 24 797 34 411 34 424 34 023 33 804 35 022 (1.2)
Training and development 1 173 20 1 720 871 793 793 3 012 1 031 1 136 279.8
Operating payments 4 296 3 596 4 190 3 218 4 682 4 682 4 761 3 677 3 603 1.7
Venues and facilities 5 310 949 3 557 3 742 5 165 5 154 7 229 4 855 5 170 40.3
Rental and hiring 1 120 569 1 471 432 1 460 1 460 1 012 1 563 1 757 (30.7)
Interest and rent on land 7 3 6 – – – – – –
Interest 7 – 6 – – – – – –
Rent on land – 3 – – – – – – –
Transfers and subsidies 20 469 66 871 8 186 4 403 9 680 9 680 6 993 5 018 5 246 (27.8)
Provinces and municipalities 15 429 41 504 – – – – – – –
Provinces – – – – – – – – –
Provincial Revenue Funds – – – – – – – – –
Provincial agencies and funds – – – – – – – – –
Municipalities 15 429 41 504 – – – – – – –
Municipalities 15 429 41 504 – – – – – – –
Municipal agencies and funds – – – – – – – – –
Departmental agencies and accounts – – – – – – – – –
Social security funds – – – – – – – – –
Provide list of entities receiving transfers – – – – – – – – –
Higher education institutions – – – – – – – – –
Foreign governments and international organisations – – – – – – – – –
Public corporations and private enterprises – – – – – – – – –
Public corporations – – – – – – – – –
Subsidies on production – – – – – – – – –
Other transfers – – – – – – – – –
Private enterprises – – – – – – – – –
Subsidies on production – – – – – – – – –
Other transfers – – – – – – – – –
Non-profit institutions – – – – – – – – –
Households 5 040 25 367 8 186 4 403 9 680 9 680 6 993 5 018 5 246 (27.8)
Social benefits 5 040 25 367 8 186 4 403 9 680 9 680 6 993 5 018 5 246 (27.8)
Other transfers to households – – – – – – – – –
Payments for capital assets 27 596 18 399 11 273 20 247 23 268 23 268 18 381 15 312 19 471 (21.0)
Buildings and other fixed structures 5 569 2 869 445 2 000 2 000 2 000 3 430 5 276 5 423 71.5
Buildings 5 569 2 869 445 2 000 2 000 2 000 3 430 5 276 5 423 71.5
Other fixed structures – – – – – – – – –
Machinery and equipment 21 165 15 194 10 828 18 247 21 268 21 268 14 451 10 036 14 048 (32.1)
Transport equipment 15 667 11 352 7 950 15 886 13 312 13 312 9 906 7 996 8 353 (25.6)
Other machinery and equipment 5 498 3 842 2 878 2 361 7 956 7 956 4 545 2 040 5 695 (42.9)
Heritage Assets – – – – – – – – –
Specialised military assets – – – – – – – – –
Biological assets – – – – – – – – –
Land and sub-soil assets – – – – – – – – –
Software and other intangible assets 862 336 – – – – 500 – –
Payments for financial assets – 557 734 – – – – – –
Total economic classification 988 820 980 929 948 921 1 002 144 1 018 371 1 018 371 1 050 901 1 087 681 1 125 881 3.2
413