Page 434 - Provincial Treasury Estimates.pdf
P. 434

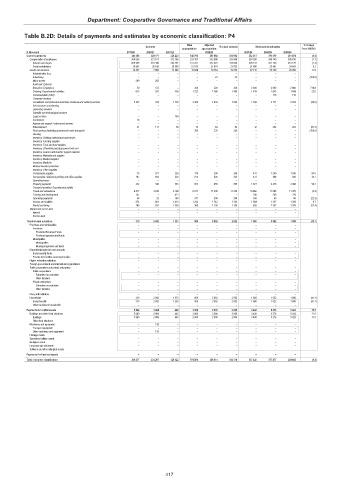
Department: Cooperative Governance and Traditional Affairs

           Table B.2D: Details of payments and estimates by economic classification: P4

                                                      Outcome       Main   Adjusted   Revised estimate  Medium-term estimates  % change
                                                                   appropriation  appropriation              from 2022/23
            R thousand                         2019/20  2020/21  2021/22   2022/23      2023/24  2024/25  2025/26
            Current payments                                  324 393                  329 171                  326 224                  348 796                  353 662                  353 662                  352 315                  370 479                  381 872  (0.4)
             Compensation of employees                        309 936                  321 511                  313 156                  333 107                  333 898                  333 898                  330 200                  345 140                  355 816  (1.1)
              Salaries and wages                              289 955                  301 405                  292 467                  311 231                  312 224                  312 066                  308 314                  321 739                  331 175  (1.2)
              Social contributions                              19 981                    20 106                    20 689                    21 876                    21 674                    21 832                    21 886                    23 401                    24 641  0.2
             Goods and services                                 14 457  7 660                    13 068                    15 689                    19 764                    19 764                    22 115                    25 339                    26 056  11.9
              Administrative fees                  –      –      –      –      –      –     –      –      –
              Advertising                          –      –      –      –     24     25     –      –      –    (100.0)
              Minor assets                        399    202     –      –      –      –     –      –      –
              Audit cost: External                 –      –      –      –      –      –     –      –      –
              Bursaries: Employees                 50    123     –     320    320    320   2 620  2 860  2 860  718.8
              Catering: Departmental activities   613    297    458   1 222  1 485  1 485  1 819  1 843  1 898  22.5
              Communication (G&S)                  –      –      –      –      –      –     –     118      118
              Computer services                    –      –      –      –      –      –     –      –      –
              Consultants and professional services: Business and advisory services  2 347  729  1 730  2 306  1 834  1 834  1 199  2 111  2 204  (34.6)
              Infrastructure and planning          –      –      –      –      –      –     –      –      –
              Laboratory services                  –      –      –      –      –      –     –      –      –
              Scientific and technological services  –    –      –      –      –      –     –      –      –
              Legal services                       –      –     164     –      –      –     –      –      –
              Contractors                          10     –      –      –      –      –     –      –      –
              Agency and support / outsourced services  –  –     –      –      –      –     –      –      –
              Entertainment                        21    111     56    72     64     64     12    202    203    (81.3)
              Fleet services (including government motor transport)  –  –  –  365  335  335  –     –      –    (100.0)
              Housing                              –      –      –      –      –      –     –      –      –
              Inventory: Clothing material and accessories  –  –  –     –      –      –     –      –      –
              Inventory: Farming supplies          –      –      –      –      –      –     –      –      –
              Inventory: Food and food supplies    –      –      –      –      –      –     –      –      –
              Inventory: Chemicals,fuel,oil,gas,wood and coal  –  –  –  –      –      –     –      –      –
              Inventory: Learner and teacher support material  –  –  –  –      –      –     –      –      –
              Inventory: Materials and supplies    –      –      –      –      –      –     –      –      –
              Inventory: Medical supplies          –      –      –      –      –      –     –      –      –
              Inventory: Medicine                  –      –      –      –      –      –     –      –      –
              Medsas inventory interface           –      –      –      –      –      –     –      –      –
              Inventory: Other supplies            –      –      –      –      –      –     –      –      –
              Consumable supplies                  75    571    229    170    208    208    411   1 240  1 240  97.6
              Consumable: Stationery,printing and office supplies  197  692  225  375  325  324  472  468  500  45.7
              Operating leases                     –      –      –      –      –      –     –      –      –
              Property payments                   372    540    585    855    855    855   1 677  2 478  2 498  96.1
              Transport provided: Departmental activity  –  –    –      –      –      –     –      –      –
              Travel and subsistence              8 517  3 240  6 198  8 011                    11 236                    11 236                    10 866                    11 085                    11 470  (3.3)
              Training and development            141     –     471     –      –      –     200   200      270
              Operating payments                   46     23    149    371    206    206    160    60     60    (22.3)
              Venues and facilities               874    601   1 410  1 242  1 742  1 742  1 859  1 337  1 359   6.7
              Rental and hiring                   795    531   1 393   380   1 130  1 130   820   1 337  1 376  (27.4)
             Interest and rent on land             –      –      –      –      –      –     –      –      –
              Interest                             –      –      –      –      –      –     –      –      –
              Rent on land                         –      –      –      –      –      –     –      –      –
            Transfers and subsidies               315    2 092  1 353  500   2 852  2 852  1 680  1 522  1 590  (41.1)
             Provinces and municipalities          –      –      –      –      –      –     –      –      –
              Provinces                            –      –      –      –      –      –     –      –      –
               Provincial Revenue Funds            –      –      –      –      –      –     –      –      –
               Provincial agencies and funds       –      –      –      –      –      –     –      –      –
              Municipalities                       –      –      –      –      –      –     –      –      –
               Municipalities                      –      –      –      –      –      –     –      –      –
               Municipal agencies and funds        –      –      –      –      –      –     –      –      –
             Departmental agencies and accounts    –      –      –      –      –      –     –      –      –
              Social security funds                –      –      –      –      –      –     –      –      –
              Provide list of entities receiving transfers  –  –  –     –      –      –     –      –      –
             Higher education institutions         –      –      –      –      –      –     –      –      –
             Foreign governments and international organisations  –  –  –  –   –      –     –      –      –
             Public corporations and private enterprises  –  –   –      –      –      –     –      –      –
              Public corporations                  –      –      –      –      –      –     –      –      –
               Subsidies on production             –      –      –      –      –      –     –      –      –
               Other transfers                     –      –      –      –      –      –     –      –      –
              Private enterprises                  –      –      –      –      –      –     –      –      –
               Subsidies on production             –      –      –      –      –      –     –      –      –
               Other transfers                     –      –      –      –      –      –     –      –      –
             Non-profit institutions               –      –      –      –      –      –     –      –      –
             Households                           315    2 092  1 353  500   2 852  2 852  1 680  1 522  1 590  (41.1)
              Social benefits                     315    2 092  1 353  500   2 852  2 852  1 680  1 522  1 590  (41.1)
              Other transfers to households        –      –      –      –      –      –     –      –      –
            Payments for capital assets           5 569  3 004  445   2 000  2 000  2 000  3 430  5 276  5 423  71.5
             Buildings and other fixed structures  5 569  2 869  445  2 000  2 000  2 000  3 430  5 276  5 423  71.5
              Buildings                           5 569  2 869  445   2 000  2 000  2 000  3 430  5 276  5 423  71.5
              Other fixed structures               –      –      –      –      –      –     –      –      –
             Machinery and equipment               –     135     –      –      –      –     –      –      –
              Transport equipment                  –      –      –      –      –      –     –      –      –
              Other machinery and equipment        –     135     –      –      –      –     –      –      –
             Heritage Assets                       –      –      –      –      –      –     –      –      –
             Specialised military assets           –      –      –      –      –      –     –      –      –
             Biological assets                     –      –      –      –      –      –     –      –      –
             Land and sub-soil assets              –      –      –      –      –      –     –      –      –
             Software and other intangible assets  –      –      –      –      –      –     –      –      –
            Payments for financial assets          –      –      –      –      –      –     –      –      –
            Total economic classification                     330 277                  334 267                  328 022                  351 296                  358 514                  358 514                  357 425                  377 277                  388 885  (0.3)


                                                             417
   429   430   431   432   433   434   435   436   437   438   439