
Page 454 - Provincial Treasury Estimates.pdf
P. 454
Department: Rural Development and Agrarian Reform
Table 7 summarises the infrastructure expenditure and estimates relating to the department from 2019/20
to 2025/26. Infrastructure expenditure decreased from R137.481 million in 2019/20 to a revised estimate
of R135.244 million in 2022/23. The high expenditure in 2019/20 was mainly due to support of the
Amajingqa Macademia Nut project. In 2023/24, the budget increases by 3.7 per cent from the 2022/23
revised estimate of R135.244 million to R140.301 million due to reprioritisation of cropping budget to fund
the SA GAP certification infrastructure in order for the producers to access markets. This is mainly due to
funds infrastructure interventions to optimise production under Red Meat, Wool and Mohair, Maize,
Vegetables, Citrus and other commodities as well as revitalisation of Agricultural Colleges in order to
reposition them to centers of excellence in their respective fields of specialization.
7.5.2 Maintenance
None.
7.5.3 Departmental Public - Private Partnership (PPP)
None.
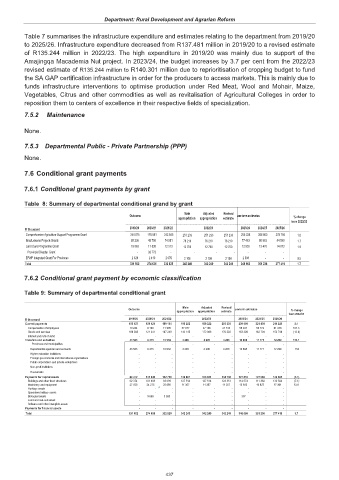
7.6 Conditional grant payments
7.6.1 Conditional grant payments by grant
Table 8: Summary of departmental conditional grand by grant
Main Adjusted Revised
Outcome um-term estimates % change
appropriation appropriation estimate
from 2022/23
R thousand 2019/20 2020/21 2021/22 2022/23 2023/24 2024/25 2025/26
Comprehensive Agriculture Support Programme Grant 244 075 176 861 243 645 251 233 251 233 251 233 255 336 266 803 278 756 1.6
Ilima/Letsema Projects Grants 65 236 49 756 74 591 76 210 76 210 76 210 77 483 80 963 84 590 1.7
Land Care Programme Grant 19 863 11 838 12 513 12 700 12 700 12 700 12 935 13 470 14 073 1.9
Provincial Disaster Grant - 33 773 - - - - - - -
EPWP Integrated Grant For Provinces 2 328 2 410 2 076 2 106 2 106 2 106 2 306 - - 9.5
Total 331 502 274 638 332 825 342 249 342 249 342 249 348 060 361 236 377 419 1.7
7.6.2 Conditional grant payment by economic classification
Table 9: Summary of departmental conditional grant
Main Adjusted Revised
Outcome um-term estimates % change
appropriation appropriation estimate
from 2022/23
R thousand 2019/20 2020/21 2021/22 2022/23 2023/24 2024/25 2025/26
Current payments 198 527 129 521 199 154 199 222 199 222 203 335 209 556 221 476 215 225 3.1
Compensation of employees 10 244 8 180 11 905 57 077 27 136 27 133 56 247 58 772 61 476 107.3
Goods and services 188 283 121 341 187 249 142 145 172 086 176 202 153 309 162 704 153 749 (13.0)
Interest and rent on land - - - - - - - - -
Transfers and subsidies 43 563 9 475 10 932 4 206 4 206 4 206 10 688 11 771 12 299 154.1
Provinces and municipalities - - - - - - - - -
Departmental agencies and accounts 43 563 9 475 10 932 4 206 4 206 4 206 10 688 11 771 12 299 154
Higher education institutions - - - - - - - - -
Foreign governments and international organisations - - - - - - - - -
Public corporations and private enterprises - - - - - - - - -
Non-profit institutions - - - - - - - - -
Households - - - - - - - - -
Payments for capital assets 89 412 135 642 122 739 138 821 138 821 134 708 127 816 127 989 149 895 (5.1)
Buildings and other fixed structures 62 374 101 698 93 699 127 514 127 514 123 351 114 574 111 362 132 504 (7.1)
Machinery and equipment 27 038 24 275 25 660 11 307 11 307 11 357 12 935 16 627 17 391 13.9
Heritage assets - - - - - - - - -
Specialised military assets - - - - - - - - -
Biological assets - 9 669 3 380 - - - 307 - -
Land and sub-soil assets - - - - - - - - -
Software and other intangible assets - - - - - - - - -
Payments for financial assets - - - - - - - - -
Total 331 502 274 638 332 825 342 249 342 249 342 249 348 060 361 236 377 419 1.7
437