Page 458 - Provincial Treasury Estimates.pdf
P. 458

Department: Rural Development and Agrarian Reform

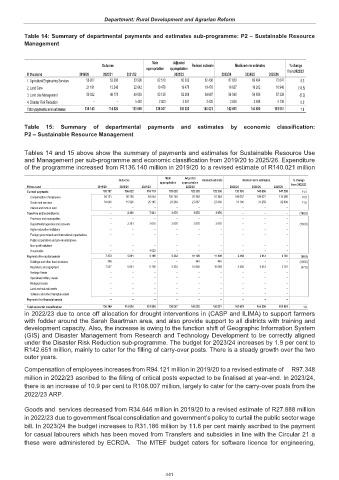
           Table 14: Summary of departmental payments and estimates sub-programme: P2 – Sustainable Resource
           Management

                                                        Main    Adjusted
                                       Outcome                        Revised estimate  Medium-term estimates  % change
                                                      appropriation  appropriation
            R thousand         2019/20  2020/21  2021/22        2022/23          2023/24  2024/25  2025/26  from 2022/23
            1. Agricultural Engineering Services                    58 927                   53 398                   53 590                   62 510                   65 033                   62 436                   67 620                   69 494                   72 647  8.3
            2. Land Care                       21 191                   13 248                   22 642                   19 478                   19 478                   19 478                   16 857                   16 202                   16 946  (13.5)
            3. Land Use Management                    56 022                  48 178                   49 883                   53 136                   52 208                   54 687                   54 548                   54 856                   57 338  (0.3)
            4. Disaster Risk Reduction                             –                            –                     5 440                     2 923                     3 301                     3 420                     3 626                     3 948                     4 130  6.0
            Total payments and estimates                  136 140                 114 824                 131 555                 138 047                 140 020                 140 021                 142 651                 144 500                 151 061  1.9

           Table 15:  Summary  of departmental payments and estimates  by economic  classification:
           P2 – Sustainable Resource Management

           Tables 14 and 15 above show the summary of payments and estimates for Sustainable Resource Use
           and Management per sub-programme and economic classification from 2019/20 to 2025/26. Expenditure
           of the programme increased from R136.140 million in 2019/20 to a revised estimate of R140.021 million

                                                             Main   Adjusted
                                            Outcome                       Revised estimate  Medium-term estimates  % change
                                                           appropriation  appropriation
            R thousand               2019/20  2020/21  2021/22      2022/23        2023/24  2024/25  2025/26  from 2022/23
            Current payments                       128 767                  106 632                  118 719                  129 038                  125 235                  125 236                  139 193                  140 886                  147 280  11.1
             Compensation of employees                     94 121                    90 706                    93 554                  105 750                    97 348                    97 348                  108 007                  109 627                  114 586  10.9
             Goods and services                      34 646                    15 926                    25 165                    23 288                    27 887                    27 888                    31 186                    31 259                    32 694  11.8
             Interest and rent on land                              –                             –                             –                             –                             –                             –                             –                             –                             –
            Transfers and subsidies to:                             –                      2 301                      7 641                      3 676                      3 676                      3 676                             –                             –                             –  (100.0)
             Provinces and municipalities                              –                             –                             –                             –                             –                             –                             –                             –                             –
             Departmental agencies and accounts                             –                      2 301                      3 618                      3 676                      3 676                      3 676                             –                             –                             –  (100.0)
             Higher education institutions                             –                             –                             –                             –                             –                             –                             –                             –                             –
             Foreign governments and international organisations                             –                             –                             –                             –                             –                             –                             –                             –                             –
             Public corporations and private enterprises                             –                             –                             –                             –                             –                             –                             –                             –                             –
             Non-profit institutions                             –                             –                             –                             –                             –                             –                             –                             –                             –
             Households                                       –                             –                      4 023                             –                             –                             –                             –                             –                             –
            Payments for capital assets                      7 373                      5 891                      5 195                      5 333                    11 109                    11 109                      3 458                      3 614                      3 781  (68.9)
             Buildings and other fixed structures                         346                             –                             –                             –                         440                         440                             –                             –                             –  (100.0)
             Machinery and equipment                      7 027                      5 891                      5 195                      5 333                    10 669                    10 669                      3 458                      3 614                      3 781  (67.6)
             Heritage Assets                                  –                             –                             –                             –                             –                             –                             –                             –                             –
             Specialised military assets                             –                             –                             –                             –                             –                             –                             –                             –                             –
             Biological assets                                –                             –                             –                             –                             –                             –                             –                             –                             –
             Land and sub-soil assets                             –                             –                             –                             –                             –                             –                             –                             –                             –
             Software and other intangible assets                             –                             –                             –                             –                             –                             –                             –                             –                             –
            Payments for financial assets                             –                             –                             –                             –                             –                             –                             –                             –                             –
            Total economic classification                  136 140                  114 824                  131 555                  138 047                  140 020                  140 021                  142 651                  144 500                  151 061  1.9
           in 2022/23 due to once off allocation for drought interventions in (CASP and ILIMA) to support farmers
           with fodder around the Sarah Baartman area, and also provide support to all districts with training and
           development capacity. Also, the increase is owing to the function shift of Geographic Information System
           (GIS) and Disaster Management from Research and Technology Development to be correctly aligned
           under the Disaster Risk Reduction sub-programme. The budget for 2023/24 increases by 1.9 per cent to
           R142.651 million, mainly to cater for the filling of carry-over posts. There is a steady growth over the two
           outer years.

           Compensation of employees increases from R94.121 million in 2019/20 to a revised estimate of      R97.348
           million in 2022/23 ascribed to the filling of critical posts expected to be finalised at year-end. In 2023/24,
           there is an increase of 10.9 per cent to R108.007 million, largely to cater for the carry-over posts from the
           2022/23 ARP.

           Goods and  services decreased from R34.646 million in 2019/20 to a revised estimate of R27.888 million
           in 2022/23 due to government fiscal consolidation and government’s policy to curtail the public sector wage
           bill. In 2023/24 the budget increases to R31.186 million by 11.8 per cent mainly ascribed to the payment
           for casual labourers which has been moved from Transfers and subsidies in line with the Circular 21 a
           these were administered by ECRDA.   The MTEF budget  caters for software licence for engineering,


                                                             441
   453   454   455   456   457   458   459   460   461   462   463