
Page 459 - Provincial Treasury Estimates.pdf
P. 459
Estimates of the Provincial Revenue and Expenditure (EPRE) – 2023/24 Financial Year
eradication of alien and invasive vegetation, fence for protection of veld and arable land and to conduct
awareness campaigns on disaster risk reduction.
Transfers and subsidies increases from R2.301 million in 2020/21 to a revised estimate of R3.676 million
attributable to payment of casual labourers. There is substantial increase in 2021/22 and this relates to the
claims against the department in respect of court order settlement on staff matters. There is no budget
over the MTEF as the budget for payment of casual labourers has been moved to goods and services.
Payments for capital assets increased from R7.373 million in 2019/20 to a revised estimate of
R11.109 million in 2022/23 due to accruals for contractual obligations such as finance leases for motor
vehicles. This explains the decline in 2023/24, whereby the budget decreases by 68.9 per cent to
R3.458 million. The budget shows a steady growth over the MTEF.
8.2.1 Service Delivery Measures
Table 16: Selected service delivery measures for the programme: P2: Sustainable Resource Use and
Management
Estimated
performance Medium-term estimates
Programme performance measures 2022/23 2023/24 2024/25 2025/26
Number of agricultural infrastructure established 95 111 113 113
Number of green jobs created through Land Care 533 340 400 450
Number of agro-ecosystem management plans developed. 6 6 6 6
Number of farm management plans developed 69 51 69 69
Number of awareness campaigns on disaster risk reduction conducted 4 2 2 –
Number of surveys on uptake for early warning information conducted 1 1 1 1
The programme supports the strategy with technical support in the agricultural infrastructure designs,
project supervision, soil conservation measures, rehabilitation of land. Ensure that regular disaster risk
surveillances are conducted to support the farmers in times of eminent disasters such as the current
drought.
8.3 Programme 3: Agricultural Producer Support and Development
Objectives: To provide support to farmers through agricultural development programmes. The programme
has the following 3 sub-programmes:
x Producer Support Services: To facilitate, coordinate and provide support to smallholder and
commercial farmers through sustainable agricultural development within agrarian reform initiatives;
x Extension and Advisory Services: To provide extension and advisory services to farmers; and
x Food Security: To support, advise and coordinate the implementation of pillar one of the Integrated
Food Security Strategy of South Africa (IFSS).
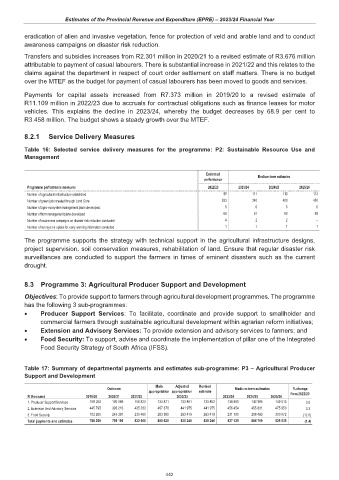
Table 17: Summary of departmental payments and estimates sub-programme: P3 – Agricultural Producer
Support and Development
Main Adjusted Revised
Outcome Medium-term estimates % change
appropriation appropriation estimate
R thousand 2019/20 2020/21 2021/22 2022/23 2023/24 2024/25 2025/26 from 2022/23
1. Producer Support Services 159 209 160 589 156 823 134 871 133 851 133 852 138 881 142 385 149 013 3.8
2. Extension And Advisory Services 445 795 393 216 435 283 457 378 441 975 441 975 456 454 455 831 475 950 3.3
3. Food Security 183 265 245 391 230 460 263 380 263 419 263 419 231 790 288 493 300 972 (12.0)
Total payments and estimates 788 269 799 196 822 566 855 629 839 245 839 246 827 125 886 709 925 935 (1.4)
442