
Page 485 - Provincial Treasury Estimates.pdf
P. 485
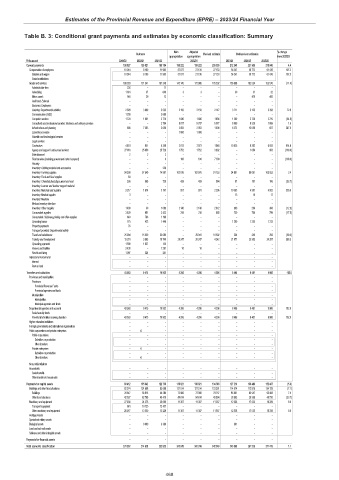
Estimates of the Provincial Revenue and Expenditure (EPRE) – 2023/24 Financial Year
Table B. 3: Conditional grant payments and estimates by economic classification: Summary
Main Adjusted % change
Outcome Revised estimate Medium-term estimates
appropriation appropriation from 2022/23
R thousand 2019/20 2020/21 2021/22 2022/23 2023/24 2024/25 2025/26
Current payments 198 527 129 521 199 154 199 222 199 222 203 335 212 345 221 306 215 046 4.4
Compensation of employees 10 244 8 180 11 905 57 077 27 136 27 133 56 247 58 772 61 476 107.3
Salaries and wages 10 244 8 180 11 905 57 077 27 136 27 133 56 247 58 772 61 476 107.3
–
–
–
Social contributions – –
–
–
–
–
Goods and services 188 283 121 341 187 249 142 145 172 086 176 202 156 098 162 534 153 570 (11.4)
–
–
–
Administrative fees 226 71 –
–
–
–
Advertising 1 031 37 648 30 31 32
3
3
–
–
–
–
–
Minor assets 146 29 12 470 492
–
–
–
Audit cost: External – –
–
–
–
–
–
–
Bursaries: Employees – –
–
–
–
–
–
Catering: Departmental activities 2 928 3 060 5 533 2 150 2 150 2 147 3 711 5 123 5 358 72.8
–
–
–
–
–
–
Communication (G&S) 1 209 3 660 –
Computer services 1 723 1 061 2 774 1 836 1 836 1 836 1 200 2 720 2 725 (34.6)
Consultants and professional services: Business and advisory services – 2 704 5 017 5 017 5 017 5 099 5 328 1 569 1.6
–
Infrastructure and planning 686 7 383 3 658 2 053 2 053 1 808 6 273 12 056 657 247.0
Laboratory services – 1 000 1 000 –
–
–
–
–
–
–
–
–
–
–
Scientific and technological services – –
–
–
–
–
–
–
Legal services – –
–
–
–
Contractors 4 674 951 4 249 2 073 2 073 1 048 10 635 6 302 6 593 914.8
–
Agency and support / outsourced services 27 016 25 650 25 729 1 752 1 752 3 802 1 054 953 (100.0)
–
2
Entertainment 2 –
–
–
2
–
–
–
–
–
Fleet services (including government motor transport) – 100 100 7 100 – (100.0)
4
–
–
–
–
–
–
–
Housing – –
–
–
–
Inventory: Clothing material and accessories – 220 –
–
–
–
Inventory: Farming supplies 94 358 57 640 74 997 102 076 102 076 91 753 94 881 99 091 103 553 3.4
–
–
–
Inventory: Food and food supplies 63 –
–
–
–
–
Inventory: Chemicals,fuel,oil,gas,wood and coal 336 568 728 439 439 594 97 101 106 (83.7)
–
–
–
–
–
–
–
Inventory: Learner and teacher support material – –
Inventory: Materials and supplies 3 217 1 674 3 147 931 931 2 296 10 353 4 381 4 582 350.9
–
–
–
Inventory: Medical supplies 3 15 16 17
–
–
–
Inventory: Medicine – –
–
–
–
–
–
–
–
–
–
–
–
–
–
Medsas inventory interface – –
Inventory: Other supplies 1 409 30 7 605 2 140 2 140 2 072 569 294 308 (72.5)
Consumable supplies 3 829 951 3 422 318 318 885 730 764 799 (17.5)
–
–
–
Consumable: Stationery,printing and office supplies 840 798 1 198 –
–
–
–
–
–
Operating leases 181 433 1 446 1 200 1 255 1 313
–
–
–
–
–
–
Property payments 76 –
–
–
–
–
–
–
–
–
Transport provided: Departmental activity – –
–
Travel and subsistence 25 004 15 530 33 085 29 941 51 502 234 245 256 (99.5)
Training and development 13 201 3 583 10 740 20 247 20 247 4 342 21 071 23 303 24 257 385.3
–
–
–
–
Operating payments 1 590 1 637 125 –
–
–
Venues and facilities 3 438 1 291 10 10 –
–
–
–
Rental and hiring 1 097 324 201 –
–
–
–
–
–
–
–
Interest and rent on land – –
–
–
–
–
–
Interest – –
–
–
–
–
–
–
–
–
–
Rent on land – –
–
–
–
–
–
Transfers and subsidies 43 563 9 475 10 932 4 206 4 206 4 206 8 496 9 481 9 906 102.0
Provinces and municipalities – –
–
–
–
–
–
–
–
Provinces – –
–
–
–
–
–
–
–
–
–
Provincial Revenue Funds – –
–
–
–
–
–
–
–
–
–
Provincial agencies and funds – –
–
–
–
–
–
Municipalities – –
–
–
–
–
–
–
–
–
–
–
Municipalities – –
–
–
–
Municipal agencies and funds – –
–
–
–
–
–
–
Departmental agencies and accounts 43 563 9 475 10 932 4 206 4 206 4 206 8 496 9 481 9 906 102.0
–
–
–
–
–
Social security funds – –
–
–
Provide list of entities receiving transfers 43 563 9 475 10 932 4 206 4 206 4 206 8 496 9 481 9 906 102.0
–
–
–
–
–
–
–
Higher education institutions – –
–
–
–
Foreign governments and international organisations – –
–
–
–
–
Public corporations and private enterprises – -0 – –
–
–
–
–
–
–
–
–
Public corporations – –
–
–
–
–
Subsidies on production – –
–
–
–
–
–
–
–
–
–
–
–
Other transfers – –
–
–
–
–
Private enterprises – -0 – –
–
–
–
–
–
–
–
–
Subsidies on production – –
–
–
–
–
–
Other transfers – -0 – –
–
–
–
Non-profit institutions
–
–
–
–
–
Households – –
–
–
–
–
–
–
–
–
–
Social benefits – –
–
Other transfers to households – –
–
–
–
–
–
–
Payments for capital assets 89 412 135 642 122 739 138 821 138 821 134 708 127 219 130 449 152 467 (5.6)
Buildings and other fixed structures 62 374 101 698 93 699 127 514 127 514 123 351 114 574 112 916 134 128 (7.1)
Buildings 20 347 38 913 44 284 72 900 72 900 79 757 85 691 83 547 93 408 7.4
Other fixed structures 42 027 62 785 49 415 54 614 54 614 43 594 28 883 29 369 40 720 (33.7)
Machinery and equipment 27 038 24 275 25 660 11 307 11 307 11 357 12 338 17 533 18 339 8.6
–
–
–
Transport equipment 961 10 725 12 431 –
–
–
Other machinery and equipment 26 077 13 550 13 229 11 307 11 307 11 357 12 338 17 533 18 339 8.6
–
–
–
–
–
–
Heritage Assets – –
–
–
–
–
Specialised military assets – –
–
–
–
–
Biological assets – 9 669 3 380 307 –
–
–
–
–
Land and sub-soil assets – –
–
–
–
–
–
–
–
–
–
–
–
–
Software and other intangible assets – –
–
–
–
–
–
–
–
Payments for financial assets – –
–
–
Total economic classification 331 502 274 638 332 825 342 249 342 249 342 249 348 060 361 236 377 419 1.7
468