
Page 481 - Provincial Treasury Estimates.pdf
P. 481
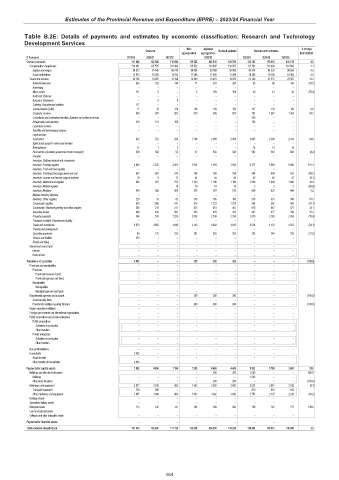
Estimates of the Provincial Revenue and Expenditure (EPRE) – 2023/24 Financial Year
Table B.2E: Details of payments and estimates by economic classification: Research and Technology
Development Services
Main Adjusted % change
Outcome Revised estimate Medium-term estimates
appropriation appropriation from 2022/23
R thousand 2019/20 2020/21 2021/22 2022/23 2023/24 2024/25 2025/26
Current payments 131 046 122 540 116 692 130 522 129 530 129 530 133 103 135 012 141 135 2.8
Compensation of employees 110 851 107 570 103 494 115 532 110 507 110 507 111 763 113 439 118 568 1.1
Salaries and wages 94 872 91 545 88 740 98 034 93 009 93 009 93 478 94 333 98 584 0.5
Social contributions 15 979 16 025 14 754 17 498 17 498 17 498 18 285 19 106 19 984 4.5
Goods and services 20 195 14 970 13 198 14 990 19 023 19 023 21 340 21 573 22 567 12.2
Administrative fees 633 120 144 71 324 324 95 96 100 (70.7)
Advertising – – – – – – – – –
Minor assets 111 5 – 6 169 169 40 41 43 (76.3)
Audit cost: External – – – – – – – – –
Bursaries: Employees – 9 9 – – – – – –
Catering: Departmental activities 177 – – – – – – – –
Communication (G&S) 17 16 126 126 126 126 127 133 139 0.8
Computer services 898 978 553 818 505 505 781 1 247 1 304 54.7
Consultants and professional services: Business and advisory services – – – – – – 200 – –
Infrastructure and planning 218 131 156 – – – 700 – –
Laboratory services – – – – – – – – –
Scientific and technological services – – – – – – – – –
Legal services – – – – – – – – –
Contractors 972 723 238 1 706 2 956 2 956 3 985 2 308 2 414 34.8
Agency and support / outsourced services – – – – – – – – –
Entertainment 11 1 2 – – – 14 14 15
Fleet services (including government motor transport) 528 544 53 57 634 634 582 582 608 (8.2)
Housing – – – – – – – – –
Inventory: Clothing material and accessories – – – – – – – – –
Inventory: Farming supplies 2 920 2 547 2 301 1 814 1 894 1 894 4 377 5 590 5 850 131.1
Inventory: Food and food supplies – – – – – – – – –
Inventory: Chemicals,fuel,oil,gas,wood and coal 657 667 470 788 788 788 404 404 422 (48.7)
Inventory: Learner and teacher support material 18 8 12 44 44 44 40 40 42 (9.1)
Inventory: Materials and supplies 682 972 702 1 523 1 186 1 186 1 600 1 900 1 988 34.9
Inventory: Medical supplies – – 10 10 10 10 2 2 2 (80.0)
Inventory: Medicine 498 526 509 579 579 579 609 637 666 5.2
Medsas inventory interface – – – – – – – – –
Inventory: Other supplies 228 15 82 155 165 165 316 331 346 91.5
Consumable supplies 623 1 396 541 973 1 223 1 223 366 382 400 (70.1)
Consumable: Stationery,printing and office supplies 380 274 211 835 461 461 618 647 677 34.1
Operating leases 669 469 591 425 425 425 647 677 708 52.2
Property payments 566 539 1 320 2 536 2 536 2 536 2 070 2 165 2 265 (18.4)
Transport provided: Departmental activity – – – – – – – – –
Travel and subsistence 8 970 4 855 4 943 2 143 4 643 4 643 3 524 4 132 4 322 (24.1)
Training and development – – – – – – – – –
Operating payments 84 175 225 381 355 355 243 245 256 (31.5)
Venues and facilities 335 – – – – – – – –
Rental and hiring – – – – – – – – –
Interest and rent on land – – – – – – – – –
Interest – – – – – – – – –
Rent on land – – – – – – – – –
Transfers and subsidies 2 492 – – 300 300 300 – – – (100.0)
Provinces and municipalities – – – – – – – – –
Provinces – – – – – – – – –
Provincial Revenue Funds – – – – – – – – –
Provincial agencies and funds – – – – – – – – –
Municipalities – – – – – – – – –
Municipalities – – – – – – – – –
Municipal agencies and funds – – – – – – – – –
Departmental agencies and accounts – – – 300 300 300 – – – (100.0)
Social security funds – – – – – – – – –
Provide list of entities receiving transfers – – – 300 300 300 – – – (100.0)
Higher education institutions – – – – – – – – –
Foreign governments and international organisations – – – – – – – – –
Public corporations and private enterprises – – – – – – – – –
Public corporations – – – – – – – – –
Subsidies on production – – – – – – – – –
Other transfers – – – – – – – – –
Private enterprises – – – – – – – – –
Subsidies on production – – – – – – – – –
Other transfers – – – – – – – – –
Non-profit institutions – – – – – – – – –
Households 2 492 – – – – – – – –
Social benefits – – – – – – – – –
Other transfers to households 2 492 – – – – – – – –
Payments for capital assets 3 992 4 060 1 104 1 206 4 426 4 426 5 832 3 789 3 963 31.8
Buildings and other fixed structures – – – – 200 200 1 500 – – 650.0
Buildings – – – – – – 1 500 – –
Other fixed structures – – – – 200 200 – – – (100.0)
Machinery and equipment 3 877 3 918 963 1 042 3 942 3 942 3 623 3 047 3 188 (8.1)
Transport equipment 790 869 – – – – 870 910 952
Other machinery and equipment 3 087 3 049 963 1 042 3 942 3 942 2 753 2 137 2 236 (30.2)
Heritage Assets – – – – – – – – –
Specialised military assets – – – – – – – – –
Biological assets 115 142 141 164 284 284 709 742 775 149.6
Land and sub-soil assets – – – – – – – – –
Software and other intangible assets – – – – – – – – –
Payments for financial assets – – – – – – – – –
Total economic classification 137 530 126 600 117 796 132 028 134 256 134 256 138 935 138 801 145 098 3.5
464