
Page 480 - Provincial Treasury Estimates.pdf
P. 480
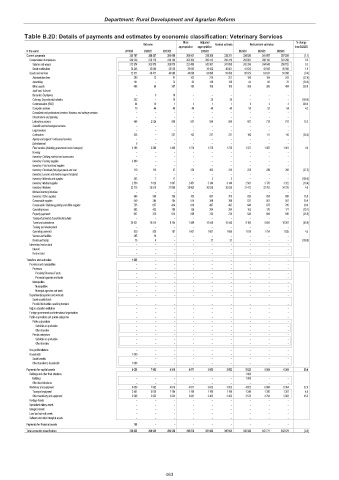
Department: Rural Development and Agrarian Reform
Table B.2D: Details of payments and estimates by economic classification: Veterinary Services
Main Adjusted % change
Outcome Revised estimate Medium-term estimates
appropriation appropriation from 2022/23
R thousand 2019/20 2020/21 2021/22 2022/23 2023/24 2024/25 2025/26
Current payments 320 797 288 587 290 688 308 001 338 309 338 311 334 520 341 687 357 206 (1.1)
Compensation of employees 248 220 239 170 246 100 262 303 282 413 282 416 283 891 288 150 301 208 0.5
Salaries and wages 212 974 203 570 209 570 222 458 242 981 241 555 242 256 244 645 255 702 0.3
Social contributions 35 246 35 600 36 530 39 845 39 432 40 861 41 635 43 505 45 506 1.9
Goods and services 72 577 49 417 44 588 45 698 55 896 55 895 50 629 53 537 55 998 (9.4)
Administrative fees 360 12 41 102 278 257 186 194 203 (27.6)
Advertising 161 – 73 62 128 128 64 66 70 (50.0)
Minor assets 498 96 357 153 109 109 369 386 404 238.5
Audit cost: External – – – – – – – – –
Bursaries: Employees – 9 18 – – – – – –
Catering: Departmental activities 252 – 18 – 30 30 – – – (100.0)
Communication (G&S) 64 19 1 3 1 1 3 3 3 200.0
Computer services 70 46 45 48 48 48 50 52 54 4.2
Consultants and professional services: Business and advisory services – – – – – – – – –
Infrastructure and planning – – – – – – – – –
Laboratory services 468 2 526 880 657 596 596 687 718 751 15.3
Scientific and technological services – – – – – – – – –
Legal services – – – – – – – – –
Contractors 525 – 237 102 237 237 106 111 116 (55.3)
Agency and support / outsourced services – – – – – – – – –
Entertainment 6 – – – – – – – –
Fleet services (including government motor transport) 5 193 3 380 1 496 1 270 1 270 1 270 1 327 1 387 1 451 4.5
Housing – – – – – – – – –
Inventory: Clothing material and accessories – – – – – – – – –
Inventory: Farming supplies 3 800 – – – – – – – –
Inventory: Food and food supplies – – – – – – – – –
Inventory: Chemicals,fuel,oil,gas,wood and coal 110 119 57 220 305 315 229 239 250 (27.3)
Inventory: Learner and teacher support material – – – – – – – – –
Inventory: Materials and supplies 263 7 17 – 3 3 – – – (100.0)
Inventory: Medical supplies 2 550 1 028 1 867 2 451 3 140 3 140 2 561 3 176 3 322 (18.4)
Inventory: Medicine 32 215 28 519 27 890 28 862 30 030 30 030 31 472 32 763 34 270 4.8
Medsas inventory interface – – – – – – – – –
Inventory: Other supplies 496 548 799 785 697 708 820 858 898 15.8
Consumable supplies 549 284 194 514 398 398 537 561 587 34.9
Consumable: Stationery,printing and office supplies 755 657 414 618 497 497 646 675 705 30.0
Operating leases 983 435 180 156 204 204 163 170 177 (20.1)
Property payments 957 379 613 599 735 735 545 569 595 (25.9)
Transport provided: Departmental activity – – – – – – – – –
Travel and subsistence 20 921 10 515 9 194 7 489 15 546 15 546 9 185 9 855 10 307 (40.9)
Training and development – – – – – – – – –
Operating payments 920 820 197 1 607 1 607 1 606 1 679 1 754 1 835 4.5
Venues and facilities 385 14 – – – – – – –
Rental and hiring 76 4 – – 37 37 – – – (100.0)
Interest and rent on land – – – – – – – – –
Interest – – – – – – – – –
Rent on land – – – – – – – – –
Transfers and subsidies 1 000 – – – – – – – –
Provinces and municipalities – – – – – – – – –
Provinces – – – – – – – – –
Provincial Revenue Funds – – – – – – – – –
Provincial agencies and funds – – – – – – – – –
Municipalities – – – – – – – – –
Municipalities – – – – – – – – –
Municipal agencies and funds – – – – – – – – –
Departmental agencies and accounts – – – – – – – – –
Social security funds – – – – – – – – –
Provide list of entities receiving transfers – – – – – – – – –
Higher education institutions – – – – – – – – –
Foreign governments and international organisations – – – – – – – – –
Public corporations and private enterprises – – – – – – – – –
Public corporations – – – – – – – – –
Subsidies on production – – – – – – – – –
Other transfers – – – – – – – – –
Private enterprises – – – – – – – – –
Subsidies on production – – – – – – – – –
Other transfers – – – – – – – – –
Non-profit institutions – – – – – – – – –
Households 1 000 – – – – – – – –
Social benefits – – – – – – – – –
Other transfers to households 1 000 – – – – – – – –
Payments for capital assets 8 050 7 962 4 818 4 871 3 653 3 653 5 822 6 084 6 364 59.4
Buildings and other fixed structures – – – – – – 1 000 – –
Buildings – – – – – – 1 000 – –
Other fixed structures – – – – – – – – –
Machinery and equipment 8 050 7 962 4 818 4 871 3 653 3 653 4 822 6 084 6 364 32.0
Transport equipment 2 451 5 030 1 194 1 190 1 190 1 190 1 244 1 300 1 361 4.5
Other machinery and equipment 5 599 2 932 3 624 3 681 2 463 2 463 3 578 4 784 5 003 45.3
Heritage Assets – – – – – – – – –
Specialised military assets – – – – – – – – –
Biological assets – – – – – – – – –
Land and sub-soil assets – – – – – – – – –
Software and other intangible assets – – – – – – – – –
Payments for financial assets 790 – – – – – – – –
Total economic classification 330 636 296 549 295 506 312 872 341 962 341 964 340 342 347 771 363 570 (0.5)
463