
Page 483 - Provincial Treasury Estimates.pdf
P. 483
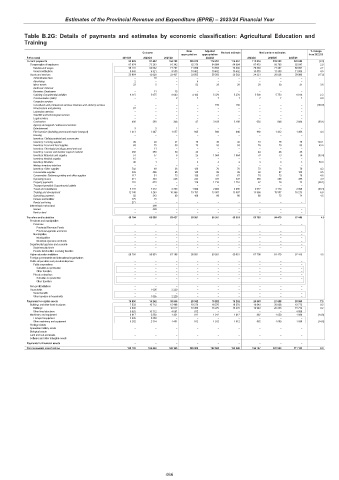
Estimates of the Provincial Revenue and Expenditure (EPRE) – 2023/24 Financial Year
Table B.2G: Details of payments and estimates by economic classification: Agricultural Education and
Training
Main Adjusted % change
Outcome Revised estimate Medium-term estimates
appropriation appropriation from 2022/23
R thousand 2019/20 2020/21 2021/22 2022/23 2023/24 2024/25 2025/26
Current payments 93 628 87 492 104 769 105 872 114 257 114 257 111 674 115 593 122 840 (2.3)
Compensation of employees 67 674 73 363 81 342 82 370 84 994 84 994 87 453 88 765 92 847 2.9
Salaries and wages 58 131 64 042 71 787 71 968 74 592 74 592 76 583 77 407 80 967 2.7
Social contributions 9 543 9 321 9 555 10 402 10 402 10 402 10 870 11 358 11 880 4.5
Goods and services 25 954 13 630 23 427 23 502 29 263 29 263 24 221 26 828 29 993 (17.2)
Administrative fees – 19 – – – – – – –
Advertising 2 – – 6 – – – – –
Minor assets 23 5 – 52 28 28 29 30 31 3.6
Audit cost: External – – – – – – – – –
Bursaries: Employees – 11 15 – – – – – –
Catering: Departmental activities 6 115 5 075 8 663 4 182 5 376 5 376 5 500 5 753 6 018 2.3
Communication (G&S) – – 2 7 7 7 7 7 7 0.0
Computer services – – – – – – – – –
Consultants and professional services: Business and advisory services – – – – 150 150 – – – (100.0)
Infrastructure and planning 87 – – – – – – – –
Laboratory services – – – – – – – – –
Scientific and technological services – – – – – – – – –
Legal services – – – – – – – – –
Contractors 400 289 346 87 3 188 3 188 636 846 2 694 (80.1)
Agency and support / outsourced services – – – – – – – – –
Entertainment 3 3 1 – – – – – –
Fleet services (including government motor transport) 1 413 1 447 1 057 945 946 946 988 1 432 1 498 4.4
Housing – – – – – – – – –
Inventory: Clothing material and accessories – – – – – – – – –
Inventory: Farming supplies 99 20 27 70 32 32 73 76 79 128.1
Inventory: Food and food supplies 63 75 59 73 53 53 76 79 83 43.4
Inventory: Chemicals,fuel,oil,gas,wood and coal – 11 – – – – – – –
Inventory: Learner and teacher support material 360 285 30 42 – – 44 46 48
Inventory: Materials and supplies 51 37 6 25 1 064 1 064 70 73 76 (93.4)
Inventory: Medical supplies 15 – – – – – – – –
Inventory: Medicine 40 1 – 3 2 2 3 3 3 50.0
Medsas inventory interface – – – – – – – – –
Inventory: Other supplies 702 89 36 130 70 70 73 76 79 4.3
Consumable supplies 283 446 86 146 89 89 93 97 100 4.5
Consumable: Stationery,printing and office supplies 117 81 73 130 67 67 70 73 76 4.5
Operating leases 271 330 228 243 337 337 350 368 385 3.9
Property payments 101 673 – 116 1 716 1 716 67 70 73 (96.1)
Transport provided: Departmental activity – – – – – – – – –
Travel and subsistence 3 131 1 212 2 363 1 988 2 985 2 985 2 077 2 170 2 396 (30.4)
Training and development 12 140 3 263 10 366 15 151 13 087 13 087 13 996 15 557 16 273 6.9
Operating payments 92 243 69 106 66 66 69 72 74 4.5
Venues and facilities 175 15 – – – – – – –
Rental and hiring 271 – – – – – – – –
Interest and rent on land – 499 – – – – – – –
Interest – 499 – – – – – – –
Rent on land – – – – – – – – –
Transfers and subsidies 58 704 60 896 63 427 59 051 59 051 59 051 61 708 64 479 67 445 4.5
Provinces and municipalities – – – – – – – – –
Provinces – – – – – – – – –
Provincial Revenue Funds – – – – – – – – –
Provincial agencies and funds – – – – – – – – –
Municipalities – – – – – – – – –
Municipalities – – – – – – – – –
Municipal agencies and funds – – – – – – – – –
Departmental agencies and accounts – – – – – – – – –
Social security funds – – – – – – – – –
Provide list of entities receiving transfers – – – – – – – – –
Higher education institutions 58 704 59 801 61 198 59 051 59 051 59 051 61 708 64 479 67 445 4.5
Foreign governments and international organisations – – – – – – – – –
Public corporations and private enterprises – – – – – – – – –
Public corporations – – – – – – – – –
Subsidies on production – – – – – – – – –
Other transfers – – – – – – – – –
Private enterprises – – – – – – – – –
Subsidies on production – – – – – – – – –
Other transfers – – – – – – – – –
Non-profit institutions – – – – – – – – –
Households – 1 095 2 229 – – – – – –
Social benefits – – – – – – – – –
Other transfers to households – 1 095 2 229 – – – – – –
Payments for capital assets 16 450 16 262 16 949 20 082 19 282 19 282 20 805 21 888 20 868 7.9
Buildings and other fixed structures 7 533 10 712 15 498 19 270 18 270 18 270 19 943 20 838 19 772 9.2
Buildings 2 008 – 10 617 18 458 18 270 18 270 19 943 20 838 15 714 9.2
Other fixed structures 5 525 10 712 4 881 812 – – – – 4 058
Machinery and equipment 8 917 5 550 1 451 812 1 012 1 012 862 1 050 1 096 (14.8)
Transport equipment 3 635 3 236 – – – – – – –
Other machinery and equipment 5 282 2 314 1 451 812 1 012 1 012 862 1 050 1 096 (14.8)
Heritage Assets – – – – – – – – –
Specialised military assets – – – – – – – – –
Biological assets – – – – – – – – –
Land and sub-soil assets – – – – – – – – –
Software and other intangible assets – – – – – – – – –
Payments for financial assets – – – – – – – – –
Total economic classification 168 782 164 650 185 145 185 005 192 590 192 590 194 187 201 960 211 153 0.8
466